

U.S. occupancy fell for a third consecutive week, dropping by more than two points to 65.7% during 8-14 August 2021.
NB: This is an article from STR
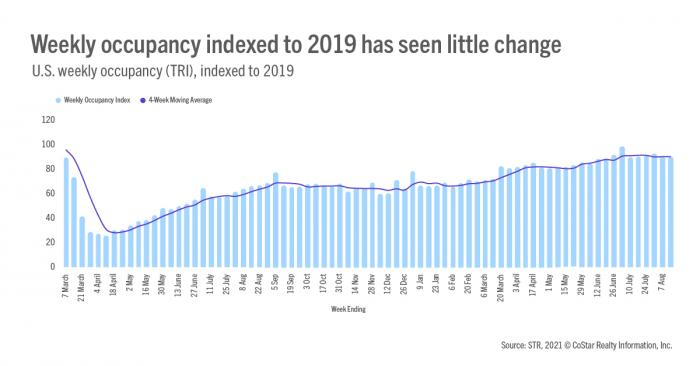
Further, weekly occupancy was down more than five points when compared with the week of 24 July 2021. On a relative basis, however, the index to 2019 was down only 0.5 points, suggesting that the occupancy decline is a result of seasonality associated with the reopening of schools across the country. The weekly occupancy index to 2019 has seen little variation in the past six weeks. Of course, some of the occupancy decline can also be attributed to the increase in COVID-19 cases due to the Delta variant.
Subscribe to our weekly newsletter and stay up to date
On a total-room-inventory basis (TRI), which accounts for temporarily closed hotels, weekly occupancy was 63.3%. Currently, only one percent of rooms (64,000) are closed with nearly half of those closures in just three cities: New York, Orlando and San Francisco.
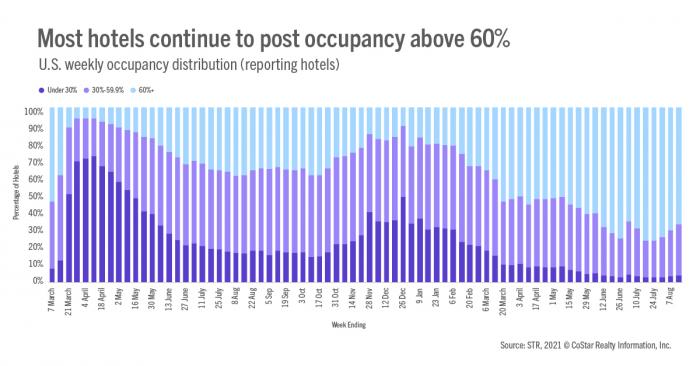
Even with the drop in occupancy, most hotels (67%) reported occupancy greater than 60% with a third showing occupancy above 80%. At the peak of summer travel, 76% of hotels reported occupancy above 60% with 43% above 80%. What is worrisome is the rate of decline for large hotels (300+ rooms), especially in Top 25 Markets. Overall, large hotels saw occupancy fall four points to 55% compared with 68% occupancy for all other hotels. In the Top 25 Markets, large hotels saw occupancy decrease by five points. Large group hotels in the Top 25 saw an even larger decline (-6pts) with weekly occupancy at 52%. In those major markets, 64% of large group hotels reported occupancy below 60% and the remaining 36% posted occupancy above 60%. During the comparable week in 2019, 82% of large group hotels in Top 25 Markets showed occupancy above 60%.
As was reported at last week’s Hotel Data Conference, group hotels accounted for a significant portion (40%) of the industry’s Q2 revenue decline with large group hotels in the Top 25 comprising 28% of the loss. What makes the impact more astonishing is that large group hotels in the Top 25 make up just 1.4% of STR’s reporting universe. Looking ahead, we expect the impact from large hotels will remain significant until the return of large groups, meetings, and more widespread business travel.
Weekly demand has dropped for three consecutive weeks with this week’s decline the largest so far. Like occupancy, when indexed to the same week in 2019, the demand decline was not out of the seasonal norm with the index decreasing only 0.1 pts week over week. Weekly demand was at 25 million, meaning an average of 3.6 million rooms sold each day of the week. At summer’s peak, 3.9 million rooms were sold on average each day.
ADR was lower for a second consecutive week, falling 1.4% week over week, which was only slightly more than in the previous week. Like the previous week, weekend ADR saw a slightly larger decrease than the weekday decline. Weekend ADR in the Top 25 Markets fell 4%, with the worst decline reported by large hotels (-6%). Overall Top 25 ADR was down 2.6% week over week as compared with -0.8% for all other remaining markets combined. Indexed to 2019, total industry nominal ADR remained strong at 106, up from 105 a week ago. Nominal industry ADR has surpassed 2019’s levels for the past seven weeks. On an inflation-adjusted basis (real), ADR has been at or above 2019’s weekly levels in four of the past seven weeks. On a market level, 63% of markets had real ADR above 2019’s level, up from 60% in the previous week.
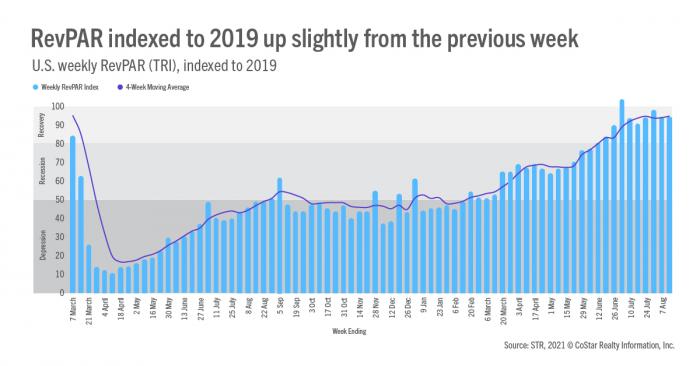
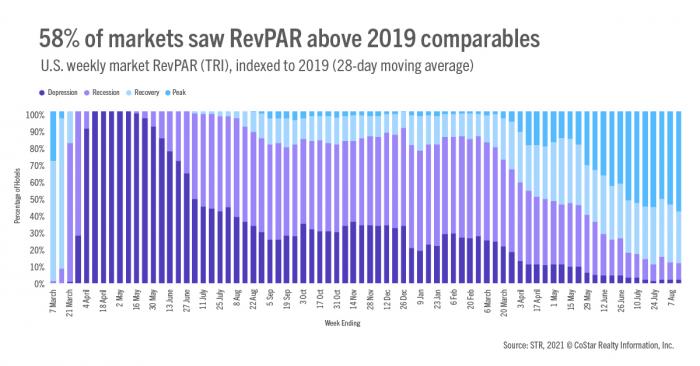
Weekly TRI RevPAR remained in the “recovery” zone (TRI RevPAR Indexed to 2019 between 80 and 100) for a 10th straight week. Despite the occupancy decrease, the index rose slightly. The same was seen when accounting for inflation. Using a 28-day moving average, 58% (97 of 166) of U.S. markets had nominal TRI RevPAR at “Peak” (TRI RevPAR Indexed to 2019 >100), the most so far, led by the Florida Keys. Forty-five percent of markets had real 28-day TRI RevPAR at “Peak,” which was also the highest percentage to date. On the flip side, 19 markets (11%) remained in “recession” (TRI RevPAR Indexed to 2019 between 50 and 80) or “depression” (TRI RevPAR Indexed under 50) with San Francisco continuing to have the lowest index (41).
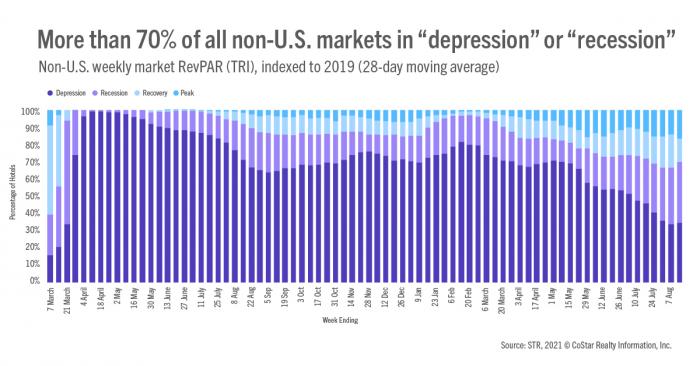
Outside of the U.S., occupancy also weakened for a third straight week, dropping by slightly more than a half point to 37.7% across 104 countries. Also, for a third consecutive week, occupancy in China fell, leveling off at 28%, its lowest occupancy since mid-February. Canada continued to see occupancy advance as fully vaccinated Americas were welcomed back. This week’s level reached another pandemic-era high (59%). Weekly occupancy in the U.K. remained stable at 65%. More than 70% of all non-U.S. markets were either in “depression” or “recession,” up from the previous week and the highest percentage in four weeks.
This week’s results had few surprises as we expected demand to wane as schools began. While it is obvious that the high points of the summer are behind us, it isn’t all doom and gloom. There is still a good percentage of hotels running healthy occupancy levels. There is no change to the expectation that performance will be lower post-Labor Day, we just have to continue to wait and see how much group and business materializes to help fill the void, especially in large group hotels, which make up a large portion of the revenue deficit faced by the industry.
About the MRM
When the U.S. hotel industry reached the one-year anniversary of the earliest COVID-19 impact, year-over-year percentage changes became less actionable when analyzing performance recovery. Thus, STR introduced a weekly Market Recovery Monitor that categorizes each STR-defined market based on an indexed comparison with the same time periods in 2019. An index is simply a ratio that divides current performance by the benchmark (2019 data).
For example, during the week ending 6 March 2021, U.S. RevPAR was $48.13. In the comparable week from 2019, RevPAR was $87.75. This produces an index of 54.8 ($48.13/$87.75*100), meaning RevPAR was slightly more than half of what it was in 2019.
We use an index to place each market in one of four categories: depression (index <50), recession (index between 50 and 79.9), recovery (index between 80 and 99.9), and peak (index >=100). Additionally, we highlight other top market performances that contribute to higher levels of recovery across the U.S.


