Dashboards don’t fail sales leaders because there isn’t enough data but because they’re stuck explaining the past. A modern sales dashboard shouldn’t exist to explain history but answers:
- Where should I act today?
- Why is performance shifting?
- Which business is worth fighting for?
- What risks or opportunities are coming next?
- That’s the difference between reporting and results.
NB: This is an article from Juyo Analytics, one of our Expert Partners
Subscribe to our weekly newsletter and stay up to date
And that shift doesn’t happen by accident. Closing the gap requires more than better charts, it requires rethinking how dashboards guide daily decisions.
So where does it start?
1. Start with prioritisation, not metrics
A sales dashboard should do what every good salesperson does instinctively: prioritise.
The top of your dashboard should instantly surface the areas where your action moves the needle, like:
- Top 5 accounts pacing behind last year.
- Feeder markets softening in the next 30 days.
- Segments with negative pickup.
- High-demand dates you can sell into.
- Uncontracted accounts showing rising transient production
This becomes your daily command centre, the difference between a dashboard you look at and a dashboard you act on.
How Juyo helps: Juyo’s Sales Analytics dashboard is fully customisable, so your “Start Here” view shows exactly what you need to focus on. Your priorities are in the front and centre every single day.
2. Make the future visible
A modern sales dashboard should help you predict the next move, not reconstruct the last one.
Here’s what that looks like when it works:
Seeing compression before it hits
Compression gives you leverage, but only if you see it far enough in advance to use it.
If your dashboard tells you “Last week was busy!”, that’s not compression. What you need is visibility into future high-demand dates so you can defend rates and time your negotiations.
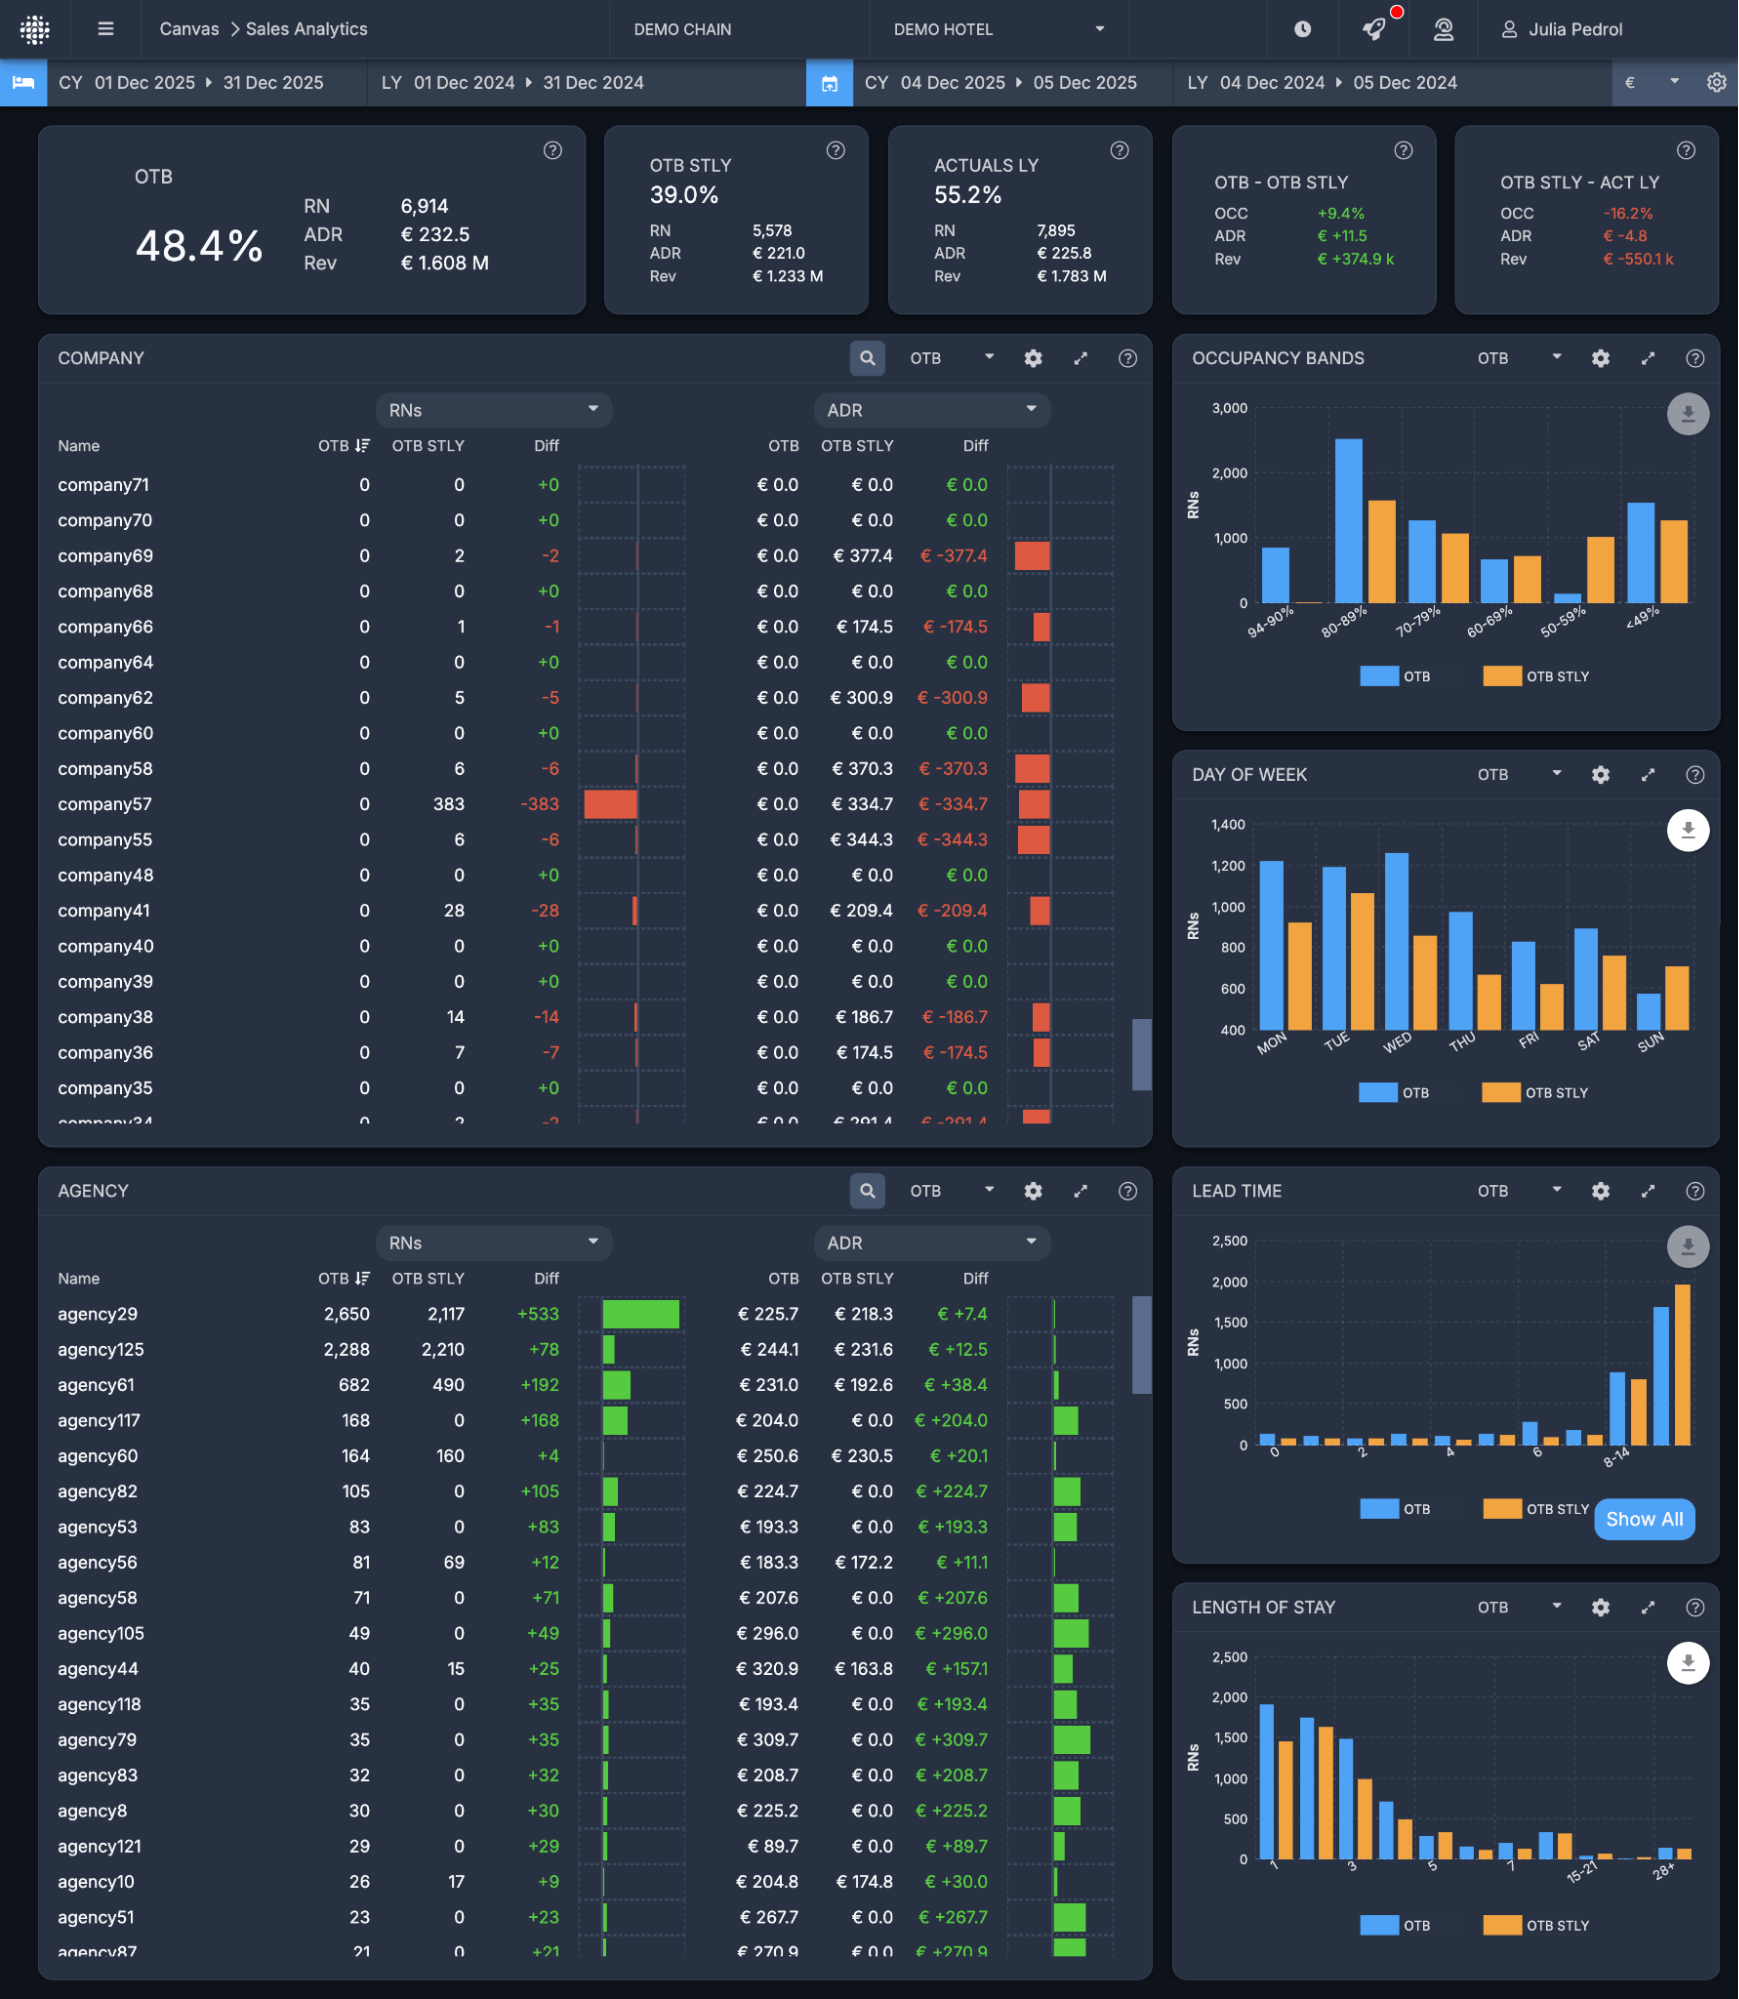
How Juyo visualises this: Explore by Occupancy Bands widget breaks down your future room nights by occupancy percentage brackets so you can quickly identify:
- When compression is building,
- where shoulder nights sit,
- how patterns compare with last year, and
- which accounts are burning your high-demand days.