

Hotel owners and operators are best positioned for success when they measure their business from every angle.
NB: This is an article from STR
That is why no benchmarking experience can be considered comprehensive without frequent insight into the bottom line. Those hoteliers who benchmark with STR find the data sets and analytics needed to cover the full hotel lifecycle, with monthly profitability features providing vital intelligence for building and executing investment and operational strategies.
Subscribe to our weekly newsletter and stay up to date
The end result? Improved operational efficiency and maximum hotel profitability.
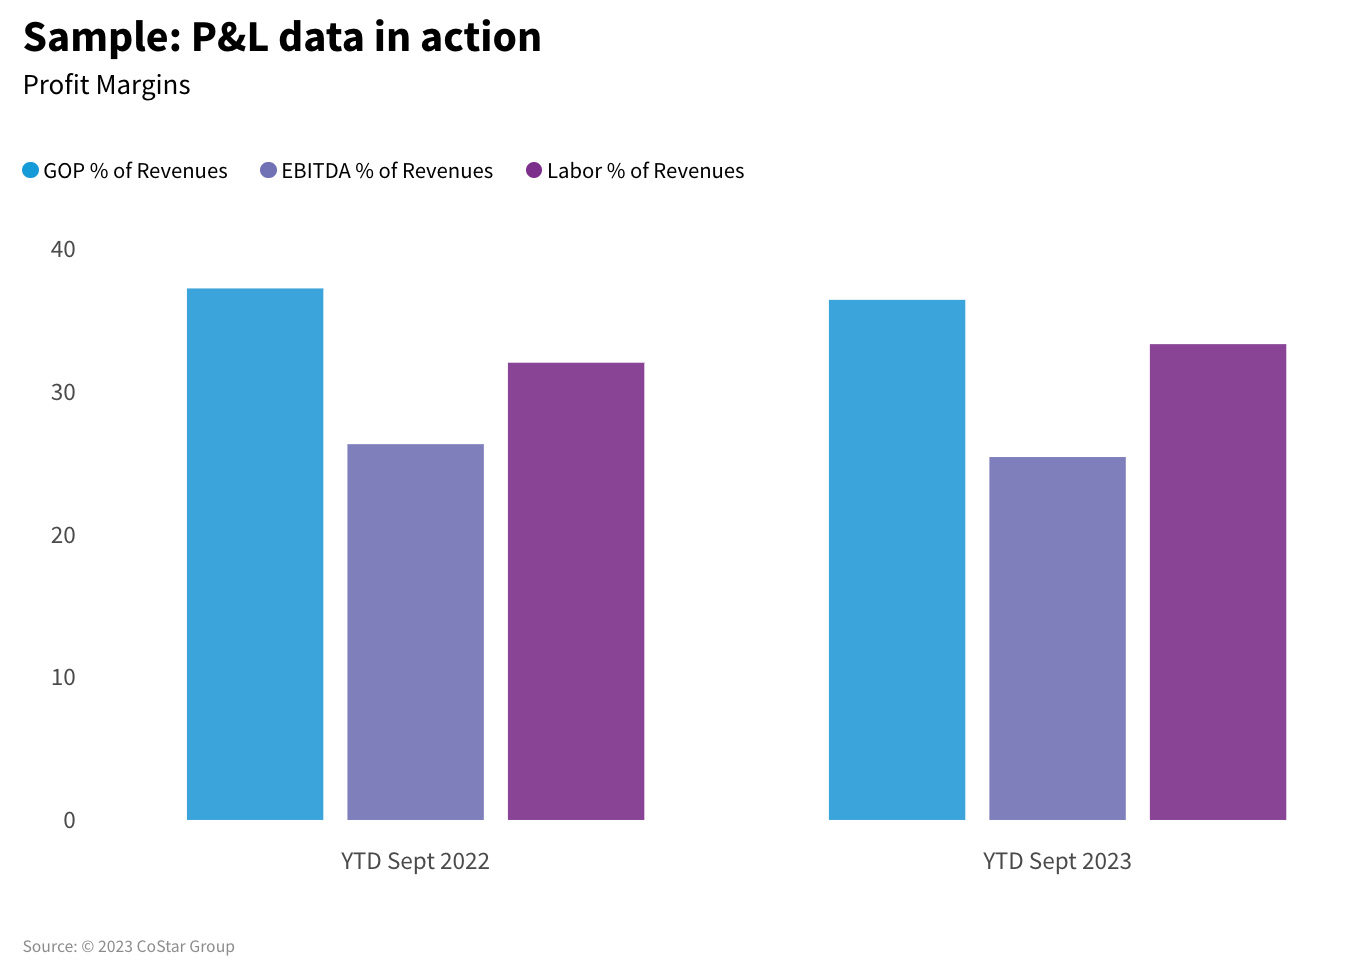
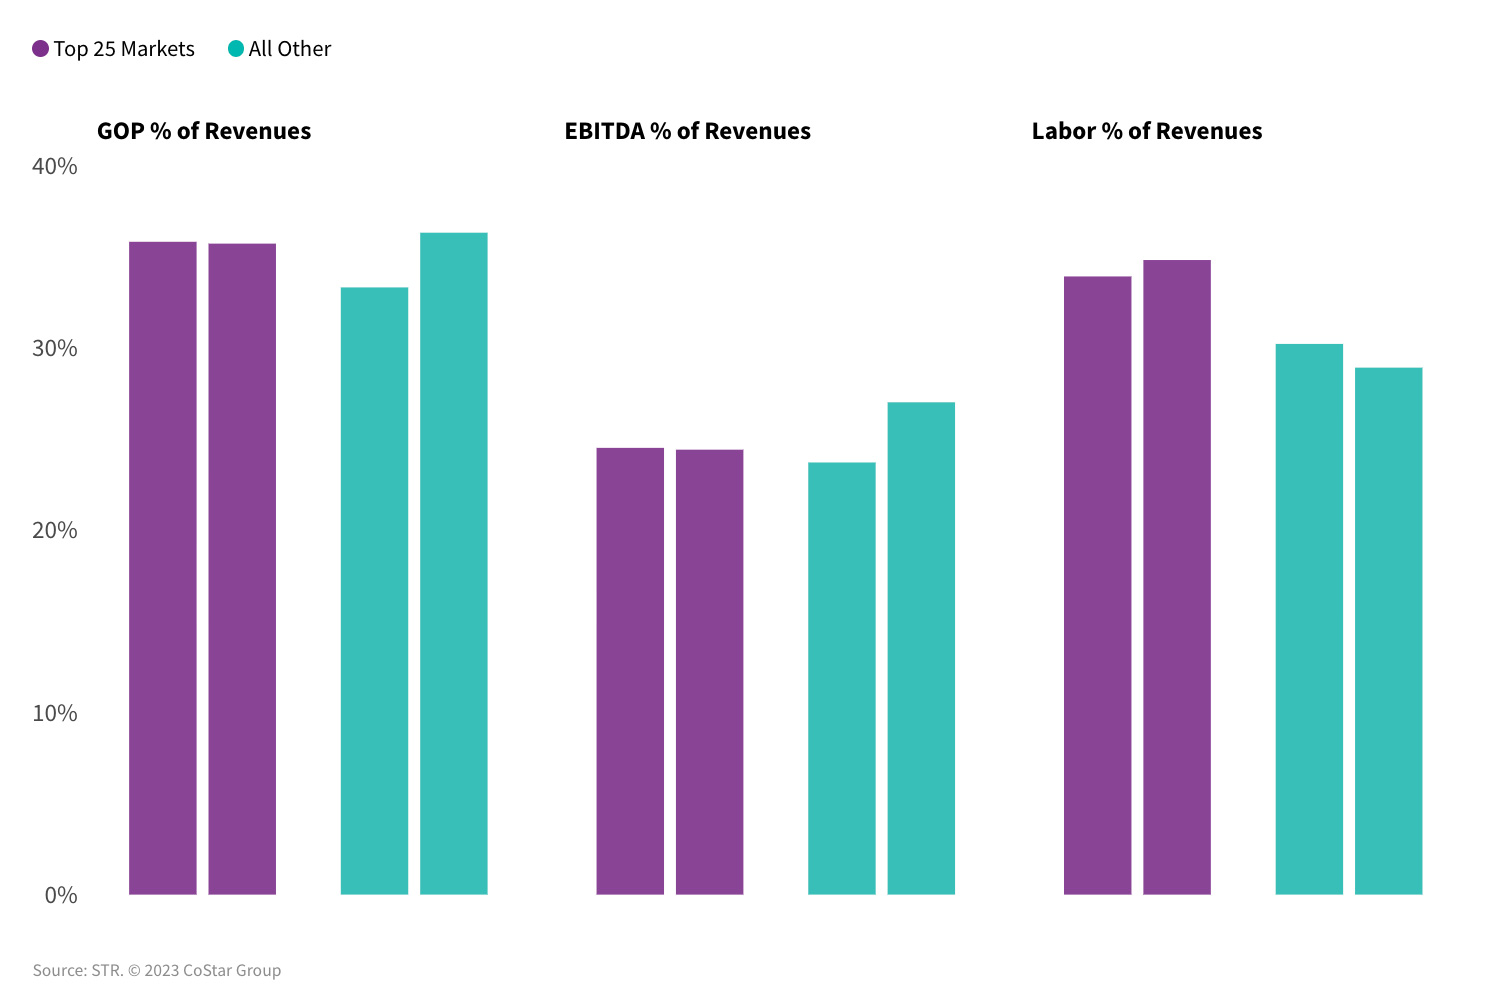
The metrics
Derived from nearly 150 data points across P&L statements, key metrics are drawn per available room night (PAR), per occupied room (POR), and as a percentage of total revenues. Key PAR indicators include:
- Total revenue per available room (TRevPAR)
- Gross operating profit per available room (GOPPAR)
- Earnings before interest, tax, depreciation, and amortization (EBITDA)
- Labor costs per available room (LPAR).
In addition to your ability to analyze individual and summary benchmarks, STR provides further analysis with flow through (ability to translate revenue to profit) and department-level metrics.
Who uses hotel P&L data? How does it support strategies?
P&L data informs better business decisions across the full spectrum of industry disciplines and stakeholders. Here are some of the more common examples:
- Owners manage their profit and assess the overall health of their business against the competition. They understand GOPPAR to create better flow through. They focus on GOP margin to implement departmental efficiency controls.
- Commercial brand teams gain visibility over their operating and labor costs relative to revenues as well as the conversion of revenues to profits given an occupancy or rate-driven strategy.
- Franchise support teams can identify standout performers and those properties that need support to grow profit through operational adjustments.
- Finance teams use profitability data to review expenses, monitor operating patterns and maximize profit for each hotel and their portfolio. Collectively with their development team, a finance team can also demonstrate to prospective franchisees a brand’s ability to generate higher average returns and/or calculate potential franchise fee revenues for differing types of industry aggregates.
- Development teams rely upon profitability metrics as one of their data sets for conducting market and project feasibility analysis.
- Investors use P&L data to gauge the financial health of a property when deciding whether to buy, sell or renovate
Key questions and answers
P&L data and insights enable you to supplement key top-line metrics and measure the impact of top-line decisions on profitability relative to the industry and competitive sets. Understanding the complete picture of your operating performance means you are ready to identify strengths and weaknesses for every department that produces revenues or expenses. That is when you can implement strategies to boost returns.
When it comes to driving your total revenue, P&L benchmarking helps you ask the right questions and find the right answers.
- How do revenue drivers in your hotels stack up against other properties in the market?
- Is all revenue growth profitable? How does this support your commercial approach?
- Are you pushing your revenues to the max potential?
- What combination of total revenue drives the best profitability relative to competitors and the market?
- How do your competitors compare in specific departments, such as F&B?
- Where does growth in top-line performance best correlate with growth in the bottom line?
- Which ancillary revenues provide the best opportunity for growth?
- Which revenue streams have little cost attached to them?


