

For the week ending 24 July 2021, absolute revenue per available room (RevPAR) broke the US$100 barrier for the first time since October 2019. At US$101, in fact, RevPAR was at its highest level since the week of 27 July 2019.
NB: This is an article from STR
With that said, demand is slowing, as expected, with summer quickly coming to an end as well as an increase in COVID-19 cases. Demand was up only 0.6% week on week, nudging occupancy to 71.4%, the country’s highest level since October 2019. Keep in mind, however, that the middle weeks of July are historically the highest occupancy weeks of the year. Overall, room demand remained above 27 million for a second consecutive week.
Subscribe to our weekly newsletter and stay up to date
Even though demand produced little week-to-week growth, weekday occupancy saw its highest level since the start of the pandemic (67.6%) with weekend occupancy dropping slightly but remaining above 80% for a second consecutive week. On a total-room-inventory basis (TRI), which accounts for temporarily closed hotels, of which 1.4% of U.S. rooms are still closed, weekly occupancy was 68.7% and RevPAR was US$98. Both of those values were the highest since October 2019.
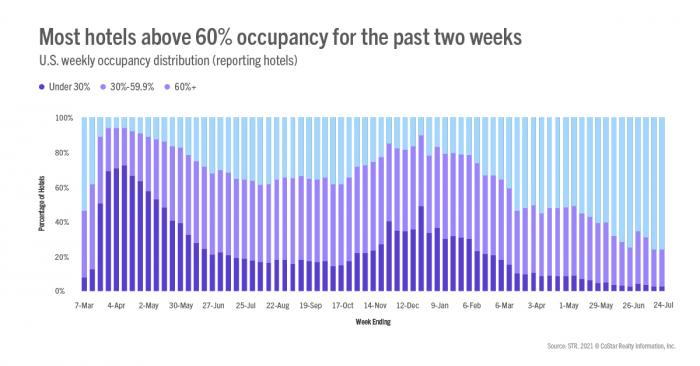
Despite increased concern and coverage in the uptick in pandemic cases, market-level demand remained solid with 38% (63 of 166) posting higher demand than in the corresponding week of 2019. That percentage was nearly unchanged from the previous week. Market occupancy ranged from 94% in Gatlinburg/Pigeon Forge (the leader for the past three weeks) to 55% in Tucson. Overall, two markets posted weekly occupancy above 90%, and 54% of all markets saw occupancy at 70% or better, down only slightly from the previous week. For a second consecutive week, more than 75% of all hotels reported occupancy of 60% or more with 21% of all U.S. hotels seeing 90%+ occupancy in the week.
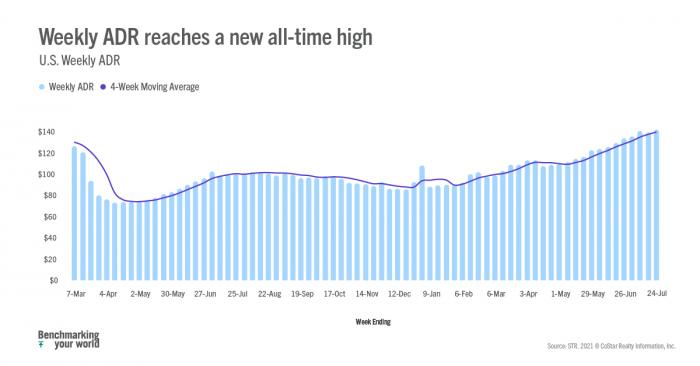
ADR (US$142) continued to push ahead to a record-breaking level. Weekend ADR also achieved a historic high (US$159) with weekday rates above US$133 for a third consecutive week. The Top 25 Markets produced ADR above $151, which was the best average for the major markets since early 2020. Outside the Top 25, ADR was again at a record level, beating the previous high set three weeks ago. For the past three weeks, more than 71% of all markets have reported weekly ADR that is higher than what it was in the comparable week of 2019. ADR in Maui, which topped US$573, was the highest of all markets, as it has been for the past 15 weeks, and remained above US$500 for a fourth straight week. Other ADR leaders included the Florida Keys, Hawaii/Kauai, Oahu, and Myrtle Beach. In all, 17 markets had weekly ADR above US$200, unchanged from the previous two weeks.
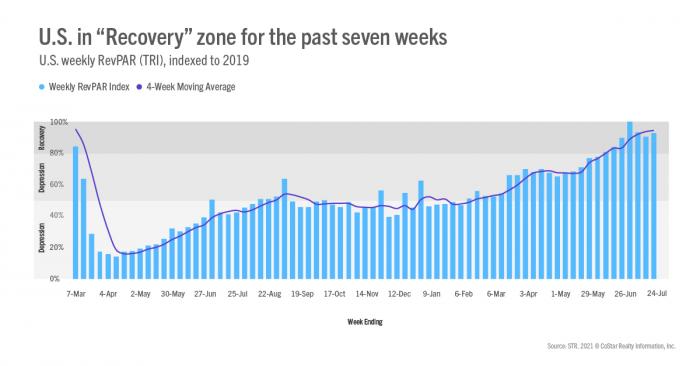
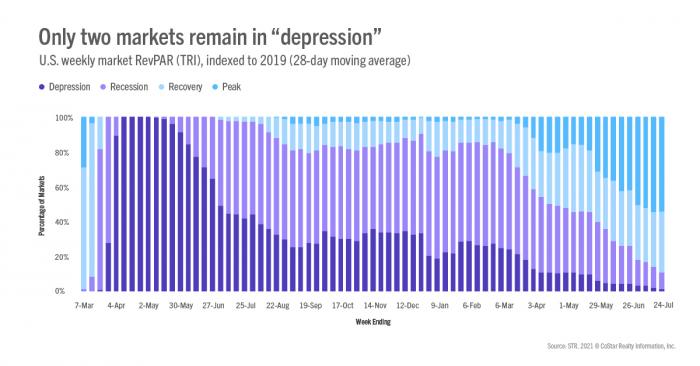
With the strong gain in RevPAR, the U.S. remained in “Recovery” as TRI RevPAR indexed to 2019 was between 80 and 100. Weekly TRI RevPAR has been in this zone for the past seven weeks, but it remains much too early to consider whether the industry has fully recovered. We expect performance to slow as children head back to in-person school. Business travel is anticipated to improve as office returns increase, but the uptick in the pandemic could affect each of those returns. Overall, 90% of all markets were either in “Recovery” or “Peak” this week, with the latter signifying that TRI RevPAR is higher than what it was in the comparable week of 2019. Only two markets, San Francisco and San Jose, remained in “Depression,” as its RevPAR was less than 50% of what it was in 2019. However, San Francisco is improving as weekly occupancy achieved 58% among open hotels, which was the market’s best since the start of the pandemic.
Outside of the U.S.
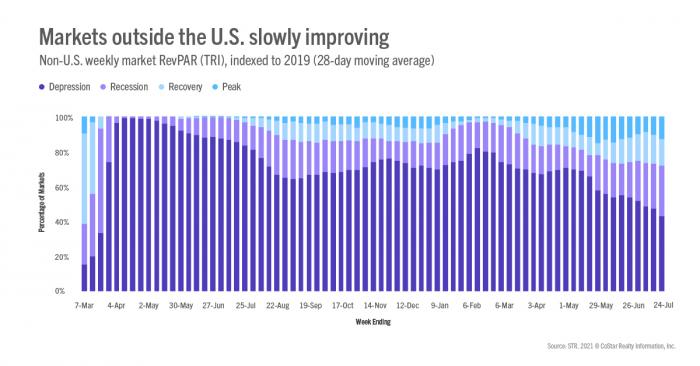
Occupancy achieved a pandemic-era high (42%) based on results from 104 countries. Room demand was 58% of the level seen in 2019. Key country occupancy ranged from 60% in China, down from the previous week, to 17% in Indonesia. The U.K. saw further improvement with occupancy reaching 60%, up 2.4 points week over week, and the country’s highest level since the pandemic’s start. Occupancy in Canada also improved to 52%, which was also its best since early 2020. Non-U.S. RevPAR remained in the “recession” category for a second consecutive week as 43% of all non-U.S. markets were in the “depression” zone, down from 52% four weeks ago. Another 29% of non-U.S. markets were in “recession.” On the positive side, 28% of non-U.S. markets were either in “recovery” or “peak,” but that percentage has seen little change over the past several weeks.
Big picture
With history as a guide, this week was likely the peak of the U.S. summer travel season. TSA screenings, along with industry room demand, saw little movement, and with schools nearing their start, stronger demand gains are not expected. The last four weeks have eased but not erased the pain caused by the pandemic. The next four weeks will likely see increased turbulence as schools reopen and as communities and individuals pause for the Delta variant.
About the MRM
When the U.S. hotel industry reached the one-year anniversary of the earliest COVID-19 impact, year-over-year percentage changes became less actionable when analyzing performance recovery. Thus, STR introduced a weekly Market Recovery Monitor that categorizes each STR-defined market based on an indexed comparison with the same time periods in 2019. An index is simply a ratio that divides current performance by the benchmark (2019 data).
For example, during the week ending 6 March 2021, U.S. RevPAR was $48.13. In the comparable week from 2019, RevPAR was $87.75. This produces an index of 54.8 ($48.13/$87.75*100), meaning RevPAR was slightly more than half of what it was in 2019.
We use an index to place each market in one of four categories: depression (index <50), recession (index between 50 and 79.9), recovery (index between 80 and 99.9), and peak (index >=100). Additionally, we highlight other top market performances that contribute to higher levels of recovery across the U.S.


