

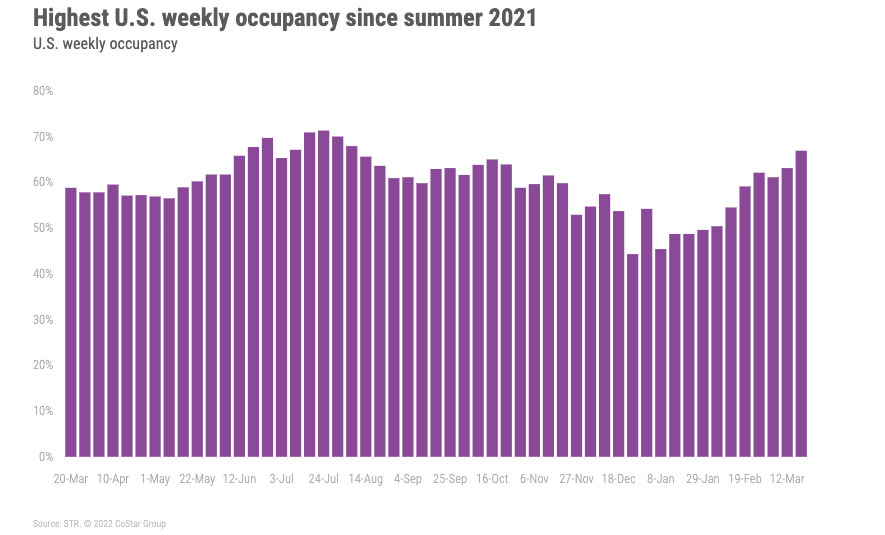
The U.S. hotel industry posted its highest weekly occupancy since the end of summer 2021 with a level of 66.9% during the week of 13-19 March 2022.
NB: This is an article from STR
Boosted by Spring Break and NCAA March Madness, one-fifth of the 166 STR-defined U.S. markets reported their highest occupancy of the past 32 weeks with 12 markets achieving pandemic-era highs. For a second consecutive week, average daily rate (ADR) increased by more than 4%, pushing the weekly level 14% higher than the 2019 comparable.
Subscribe to our weekly newsletter and stay up to date
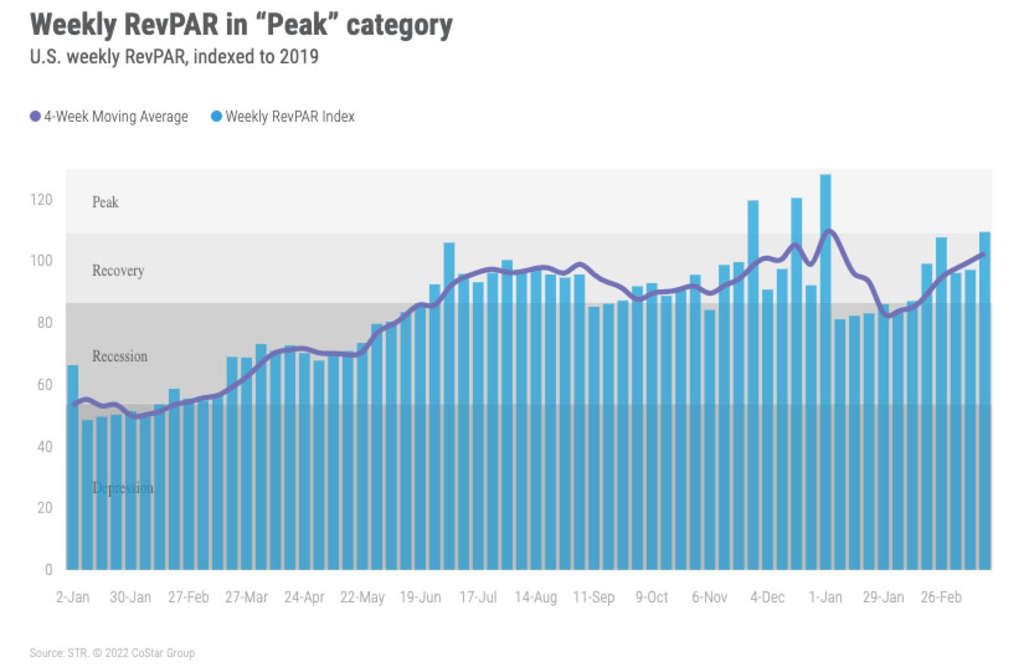
Revenue per available room (RevPAR) also increased sharply, up 11% week on week and 10% from the corresponding week in 2019.
Of the 12 markets that reached pandemic-era highs in occupancy, four were in Texas (Austin, Dallas, Fort Worth/Arlington, and San Antonio), four were in Florida (Florida Central, Melbourne, Orlando, and Tampa), and two were in Arizona. As a result, Arizona, Florida, and Texas also recorded their highest statewide occupancies since the start of the pandemic: Florida (87.4%), Arizona (82.9%) and Texas (72.7%).
Nine of this week’s 10 highest occupancy markets were in Florida, led again by the Florida Keys. Orlando, the nation’s second largest market based on hotel supply, posted the fourth highest occupancy, which surpassed 90%. The only market in the top 10 not in Florida was San Antonio, which recorded an occupancy of 86.9%.
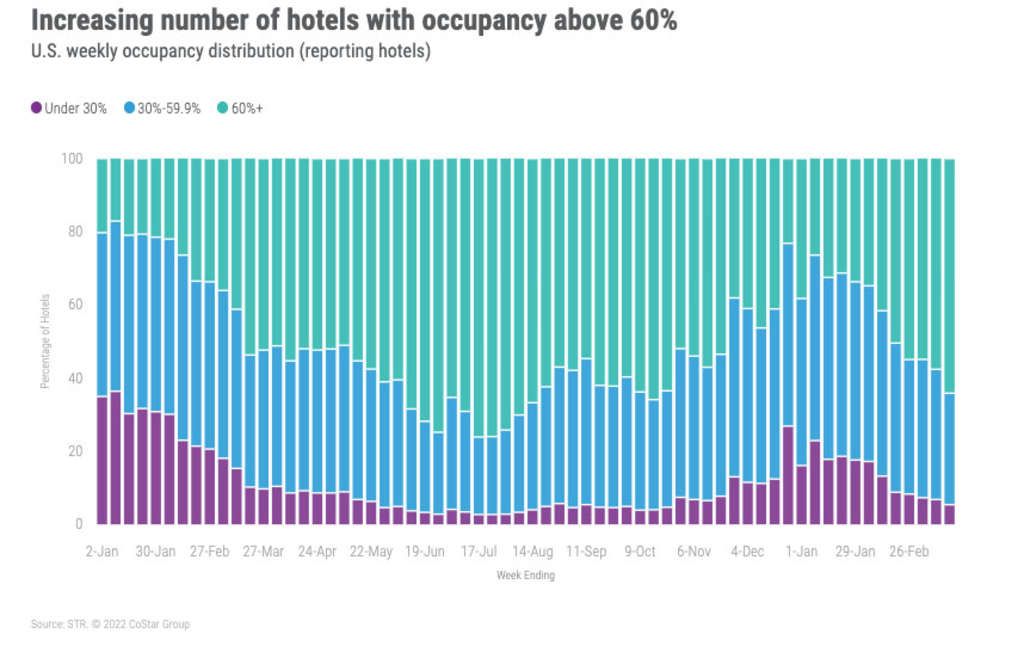
More than 64% of hotels saw occupancy surpass 60% this week, the most since mid-October. In the Top 25 Markets, more than 74% of hotels reported occupancy above 60%, which was the most since July 2021. As a result, occupancy in the Top 25 Markets (71.6%) was at its highest weekly level since early 2020. Weekday (68.9%) and weekend (80.7%) occupancy for the Top 25 also hit pandemic-era records. Shoulder days (Sunday and Thursday) produced their second highest occupancy (66.5%) of the pandemic-era.
After hitting a pandemic-era high the week prior, group demand fell (1.6 million to 1.4 million), which was likely due to Spring Break, as a significant number of schools were on holiday. Despite the decrease in group demand, the upper upscale segment saw its highest occupancy (67.1%) since the start of the pandemic. Luxury chains also set a pandemic-era record (69.3%). For the week, the highest occupancy was in the upscale (71.5%) and upper midscale (70.1%) segments, but neither was a pandemic-era high. The week’s upscale occupancy was the fourth highest since the start of the pandemic, while upper midscale occupancy was ninth best during that time. Weekday (Monday-Wednesday) occupancy in the Top 25 Markets for luxury (67.5%), upper upscale (65.9%), upscale (71.7%), and upper midscale (70.7%) were all pandemic-era highs.
Central Business Districts (CBDs) continued to improve as well. CBD occupancy reached 67.3%, which was the highest mark since March 2020. Weekday occupancy also hit a high for that period at 63.8%
ADR continued to show robust gains with the week’s level (US$152) the second highest ever recorded by STR, behind Christmas 2021. Recall, a week ago, the same was true. Adjusted for inflation, ADR was also higher than in the matching week of 2019 by a little more than 1%. Twenty-three markets reported ADR growth of 10% or more, led by Colorado Area (+19.1%), which includes the ski resorts of Aspen, Beaver Creek, and Vail, along with Boulder, Fort Collins, and others. San Antonio and Orlando, which saw high occupancies, also reported strong ADR growth of 16.9% and 16.6%, respectively. Weekdays and shoulder days drove the week’s gain with both day types increasing by more than 6%, whereas the weekend produced only moderate growth (+2.2%) even with the highest absolute level (US$162). While occupancy continued to grow in CBDs, ADR growth was rather muted at 1.7%. Weekday CBD ADR growth was only slightly better (+2.6%).
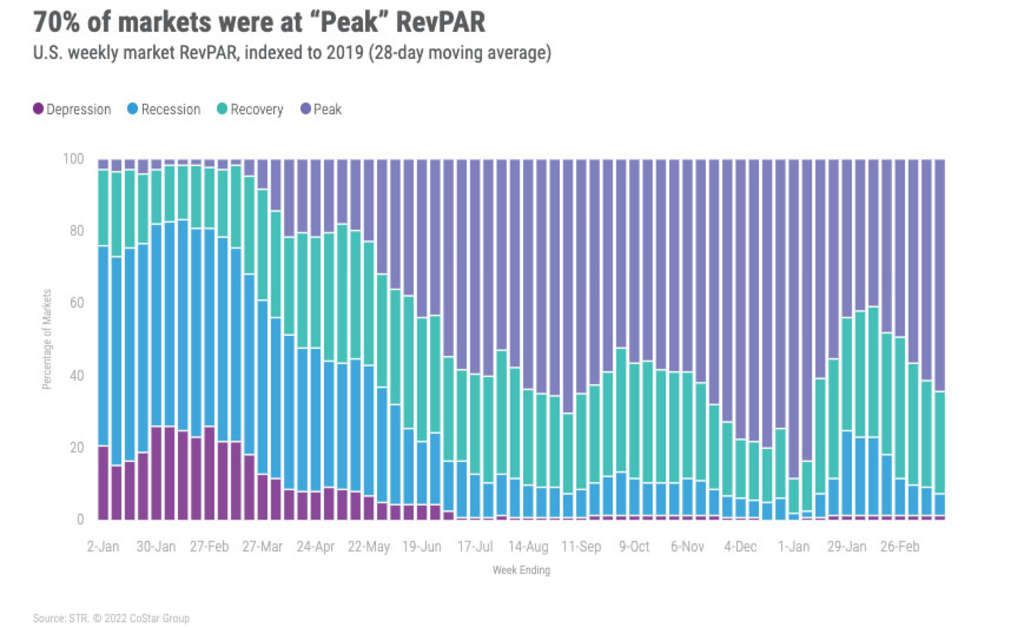
For only the seventh time since the start of the pandemic, weekly RevPAR was higher than what it was in the comparable week of 2019. This was also only the third time since March 2020 where RevPAR surpassed US$100, making this week’s result the second highest of the pandemic-era. Seventy percent of markets were at “Peak” RevPAR (RevPAR indexed to 2019 above 100). On an inflation-adjusted basis, U.S. RevPAR was 4% lower than what it was in 2019 with 49% of markets at “Peak” RevPAR. Looking at the past four weeks, RevPAR was 3% higher than what it was in the same four weeks of 2019. On an inflation-adjusted basis, RevPAR remained at an 8% deficit to 2019.
Around the Globe
Outside of the U.S., occupancy increased 1.5 percentage points week over week to 54.1%. ADR also increased 6.4% to US$123, supporting a 9.4% RevPAR boost. Twenty of the countries tracked on a weekly basis saw a drop in occupancy this week with the most impactful decrease coming in China with COVID restrictions put in place continue to combat its latest outbreak. Demand in China was down 1.4 million room nights versus the previous week with occupancy falling to 38%. Puerto Rico overtook the United Arab Emirates for the top occupancy spot around the world at 88.3%. The UAE did however continue to see strong results, however, coming in at a close second (87.7%) as Expo 2020 continues to drive strong results in its final weeks. The Middle East (79.9%) had the highest occupancy of any subcontinent with Northeastern Asia the lowest (39.8%).
Ireland, which benefited from St. Patrick’s Day and a Rugby Union Six Nations match, saw a sharp increase in occupancy, up 12.2 percentage points to 73.1%, its highest level since the start of the pandemic. ADR followed suit, up by 28.9% to EUR162.96.
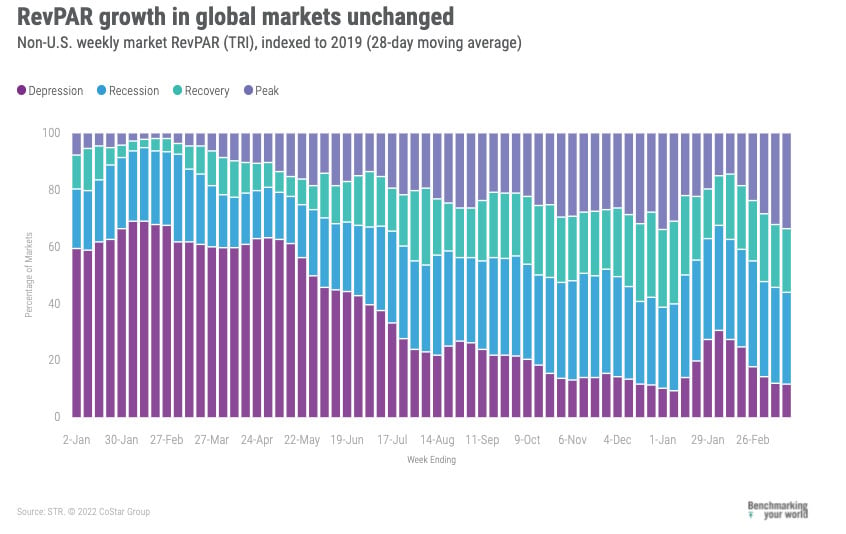
Over the past 28 days, 32% of non-U.S. markets remained in “Recession” (RevPAR indexed to 2019 between 50 and 80) with another 12% in “Depression” (RevPAR indexed to 2019 under 50). This is an improvement compared with last week, demonstrating recovery across the globe. Note, a week ago, our analysis was based on using STR’s TRI methodology. From this week on, these percentages will be based on the Standard methodology with most temporary closures due to the pandemic now in the past.
Looking Ahead
While Spring Break will continue through the second week of April, last week was likely the peak according to STR’s School Break Report. Sunday, 20 March 2022 had the second highest TSA security screenings since the start of the pandemic, the highest being the Wednesday before Thanksgiving 2021, which likely signifies people coming home rather than going on vacation. Given that travel volume, we expect demand will come down from the level seen last week but remain moderately solid through the remainder of Spring and then strengthen as we head into summer 2022.


