
U.S. hotel occupancy hit 72.3% week ending 25 June 2022, the highest level since the week ending 10 August 2019.
NB: This is an article from STR
Occupancy increased 0.5 percentage points week on week, which was a third straight weekly increase, and was up 2.6 percentage points versus a year ago. Room demand also rose to a 3-year high at 28.2 million. Demand has been above 28 million for the past two weeks.
Subscribe to our weekly newsletter and stay up to date
In all of 2019, demand was only above that level seven times, but the most recent week’s result was still lower (-1.3%) than what it was in the comparable week in 2019. Nominal average daily rate (ADR) gained 1.1% week on week to US$157, which was the second highest value since weekly reporting began—behind only the week of New Year’s 2022 (US$159). Nominal ADR was 17% higher than in the comparable week of 2019 and 17% (+US$23) higher than a year ago. Nominal revenue per available room (RevPAR) reached a 22-year high (US$114) and was 12% higher than the matching week of 2019 as well as 21% greater than last year.
Not only was the week’s demand the best of the pandemic era, it was also the 15th highest for any week since 2000. Of the 25 highest demand records, two have occurred this year and over the past two weeks. The highest weekly demand ever recorded occurred in the week ending 20 July 2019 when 29.6 million rooms were sold. Furthermore, for weeks that have ended in the month of June, this week’s result was the fifth highest since STR began benchmarking weekly performance.

The growth in demand was led by upscale and upper midscale hotels. Both these chains scales saw their highest weekly room demand of the past 22 years, topping the record that each set a week prior.
Twenty-two markets set pandemic-era demand records, including Nashville, Portland, and Seattle. Sixteen others, including Chicago, Dallas, Denver, New York City, and San Diego, reported their second highest demand since March 2020. Five markets, mostly smaller like Allentown/Reading, PA and Greenville/Spartanburg reported their highest weekly demand going back to 2000. Nashville was the large market to appear in that group with its highest weekly demand since STR began benchmarking weekly levels. In the comparable week of 2000, Nashville demand was 155,000, whereas for this week in late June 2022, room nights sold topped 315,000 and drove occupancy of 81%. Orlando sold the most rooms this week (765,000) overall with its fifth highest volume since the start of the pandemic. More striking, Orlando’s demand was the highest ever recorded for a week ending in the month of June.
Market occupancy was again led by Alaska (90%), its third week in the top spot. The state was followed by Portland, ME (89%), Omaha (87%), and New York City (87%). Of the 10 largest markets in the country, based on supply and excluding Las Vegas, New York City had the highest occupancy, followed by Orlando (80%) and Chicago (76%). Overall, 59% of the 166 STR-defined markets reported weekly occupancy above 70%, which was the most since the start of the pandemic with 12% seeing occupancy greater than 80%.
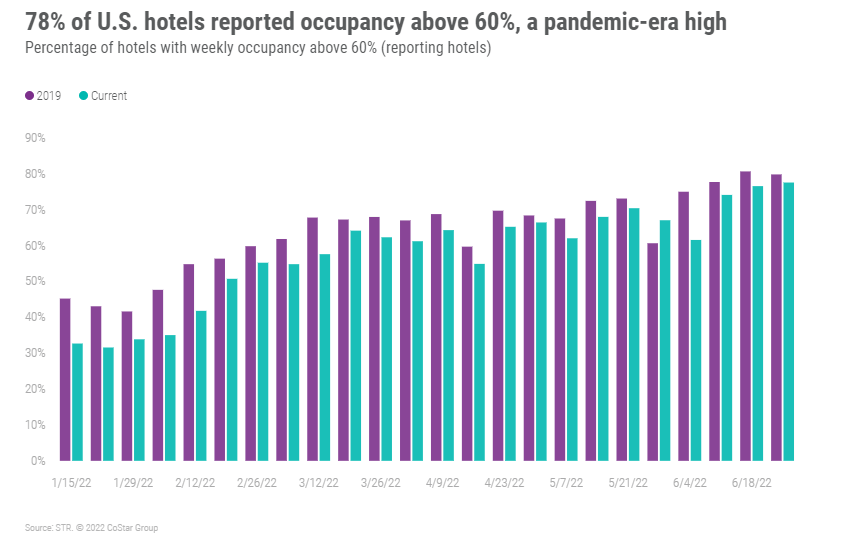
Occupancy in the Top 25 Markets was slightly down week on week to 75%, which was the second highest level of the pandemic-era behind the previous week. In the comparable week of 2019, Top 25 Market occupancy stood at 80%, while a year ago it was 67%. Demand in the Top 25, however, was the third highest ever recorded for this particular week with the highest such level occurring in 2019. The Top 25 was led by New York City, but nearly every market reported occupancy above 70% except seven. Houston posted the lowest occupancy (59%) of the group but was slightly higher than a year ago.
Occupancy in central business districts (CBDs) dropped for a third consecutive week (week on week) with occupancy of 74%, the third highest level since the start of the pandemic with a high mark occurring three weeks ago. Of the 20 submarkets with CBD in their name (and including the New York Financial District), the NYC Financial District had the highest occupancy (89%) followed by Seattle CBD (85%), San Diego CBD (85%), and Nashville CBD (83%).
Weekday occupancy (Monday-Wednesday) was 71%, down slightly from a week ago. Excluding Monday, the two-day average reached 74% and was the highest since the start of the pandemic. Weekend (Friday & Saturday) occupancy was 81%, the third highest since March 2002, however, demand was at a pandemic-era high. By day, occupancy on Wednesday (75%) and Thursday (74%) reached an era high. Among the Top 25 Markets and CBDs, new pandemic-era highs were seen Wednesday through Friday.
Nominal ADR was at the second highest level ever recorded. On an inflation-adjusted basis, real ADR was the 15th highest since 2000 and second highest since the start of the pandemic. Fifteen markets saw their highest real ADR since the start of the pandemic, including Denver, San Diego, and Seattle. The list of real ADR record holders increased to 22 when looking just at weeks ending in June. Included in that list is Tampa (real ADR: US$144) and Orlando (real ADR: US$132).
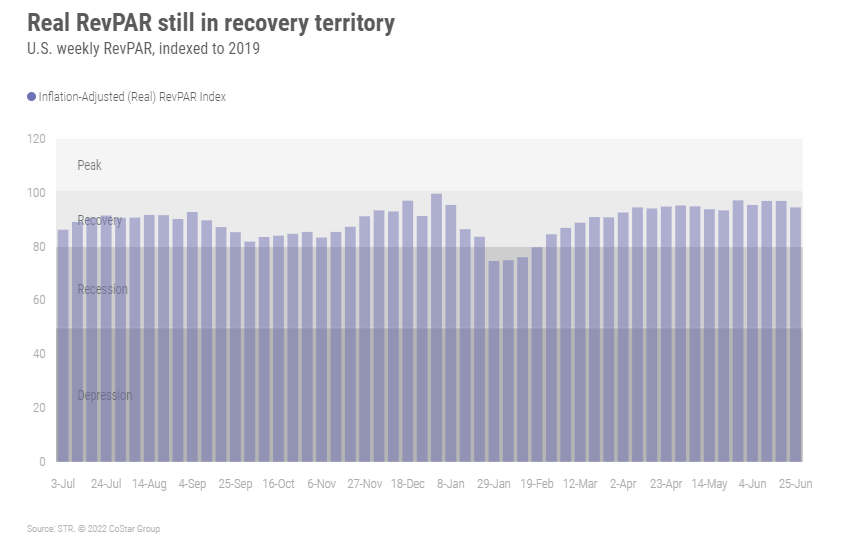
In each the past three weeks, nominal RevPAR hit a new pandemic-era highs, increasing from US$110 three weeks ago to US$114 in the most recent week. Prior to the past three weeks, the previous record (US$107) was established in the week ending 28 July 2018. Real RevPAR ($US99) also reached a pandemic-era high and has topped itself in each of the past three weeks. While weekly real RevPAR was the highest of the current era, it ranked 37th going back to 2000 with the highest real RevPAR surpassing US$109 in the week ending 23 July 2016.
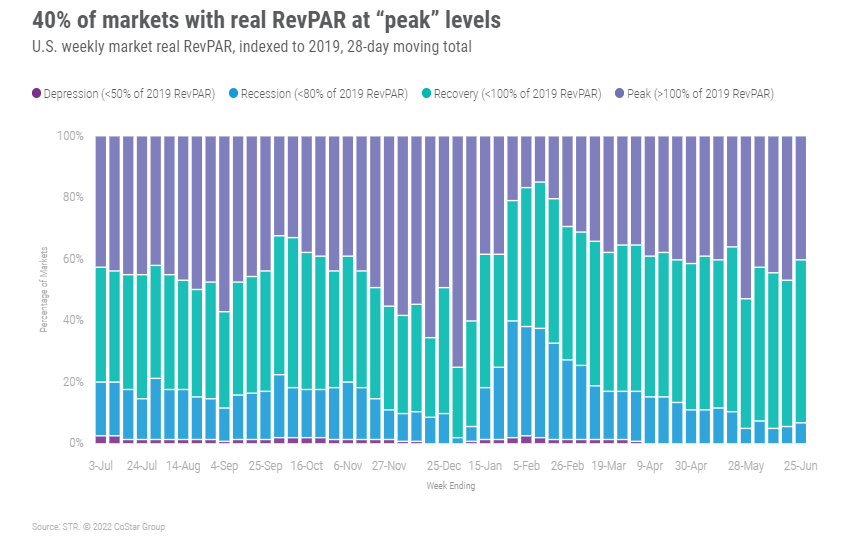
On a market level, 95 had “peak” (RevPAR indexed to 2019 above 100) real RevPAR including Austin, Dallas, New Orleans, and San Diego. Over the past four weeks, 67 markets were at “peak” real RevPAR, including Austin, Miami, Orlando, Phoenix, and San Diego. The bulk of markets (88) are still in “recovery” (real RevPAR indexed to 2019 between 80 and 100) with only 11 in “depression” (real RevPAR indexed to 2019 between 50 and 80).
Around the Globe
Outside of the U.S., occupancy increased 1.2 percentage points week over week to 66.3%, which was the highest level of the pandemic-era. ADR also increased to US$137, resulting in a 3.0% RevPAR gain. Despite the overall gain by the industry, 52 of the countries tracked on a weekly basis saw a week-over-week drop in occupancy – a regression compared to the prior week’s performance. Strong gains in Germany, China, Japan, Indonesia, and Brazil offset the losses of those countries.
Germany’s occupancy increased 10 percentage points week on week as Stuttgart, Frankfurt, Dusseldorf, Munich and Cologne all saw double-digit occupancy growth. Strong performance was supported by the commencement of the holiday season and events. Stuttgart, for example, hosted Automative Testing Expo, LASYS and SurfaceTechnology, which boosted occupancy and ADR by 26.2 percentage points and 32.8%, respectively. Dusseldorf saw stellar rate increases for the week, up 93% thanks to WIRE, TUBE and METAV.
São Paulo saw an 11-percentage point week-over-week occupancy growth to 66%, just 3.3% behind the comparable month in 2019. The Copa do Brasil Round of 16 game took place at Neo Química Arena, which also helped to drive demand in the Brazilian city.
Occupancy remained strong in Greece (83%), which propelled ADR ahead of the comparable week in 2019 by 36%. Northern Europe again saw the highest occupancy (81%) of any subcontinent, down 1.6 percentage points compared with the prior week as Southern Africa had the lowest (54%)
Over the past 28 days, 15% of non-U.S. markets remained in “Recession” (RevPAR indexed to 2019 between 50 and 80) with another 2% in “Depression” (RevPAR indexed to 2019 under 50).

Big Picture
While ADR gains are the talk of the town, demand continues to be our central focus given the concerning news on the economy and travel hassles. At this point, it appears that the industry has momentum and that any impact to demand by a slowing economy or other factors will not be seen any time soon. However, the week before a holiday tends to slow before gaining strength. This could be the case for the week ending 2 July 2022. TSA screenings reflected the highest seven-day average (for 26 June) since the start of the pandemic, but daily volumes since then have fallen slightly. However, we still anticipate the industry to hit pandemic-era highs in demand, occupancy, nominal ADR and nominal RevPAR in July before starting its seasonal decline.

