

When will things be “normal” again? It’s the single most pervasive question in travel today and one of the most difficult to answer.
NB: This is an article from Koddi
Full recovery will not happen overnight – and will likely not even happen in 2020. It will happen city by city, state by state, intraregionally, and then internationally, as we collectively enter a new sort of normal that puts customer safety at the heart of the business.
In these early stages of the pandemic, doing right by your business, your employees, and your stakeholders means analyzing the market, remaining cautious, and seizing opportunities as communities recover and economies rebuild.
Assessing Risk at Each Stage of Recovery
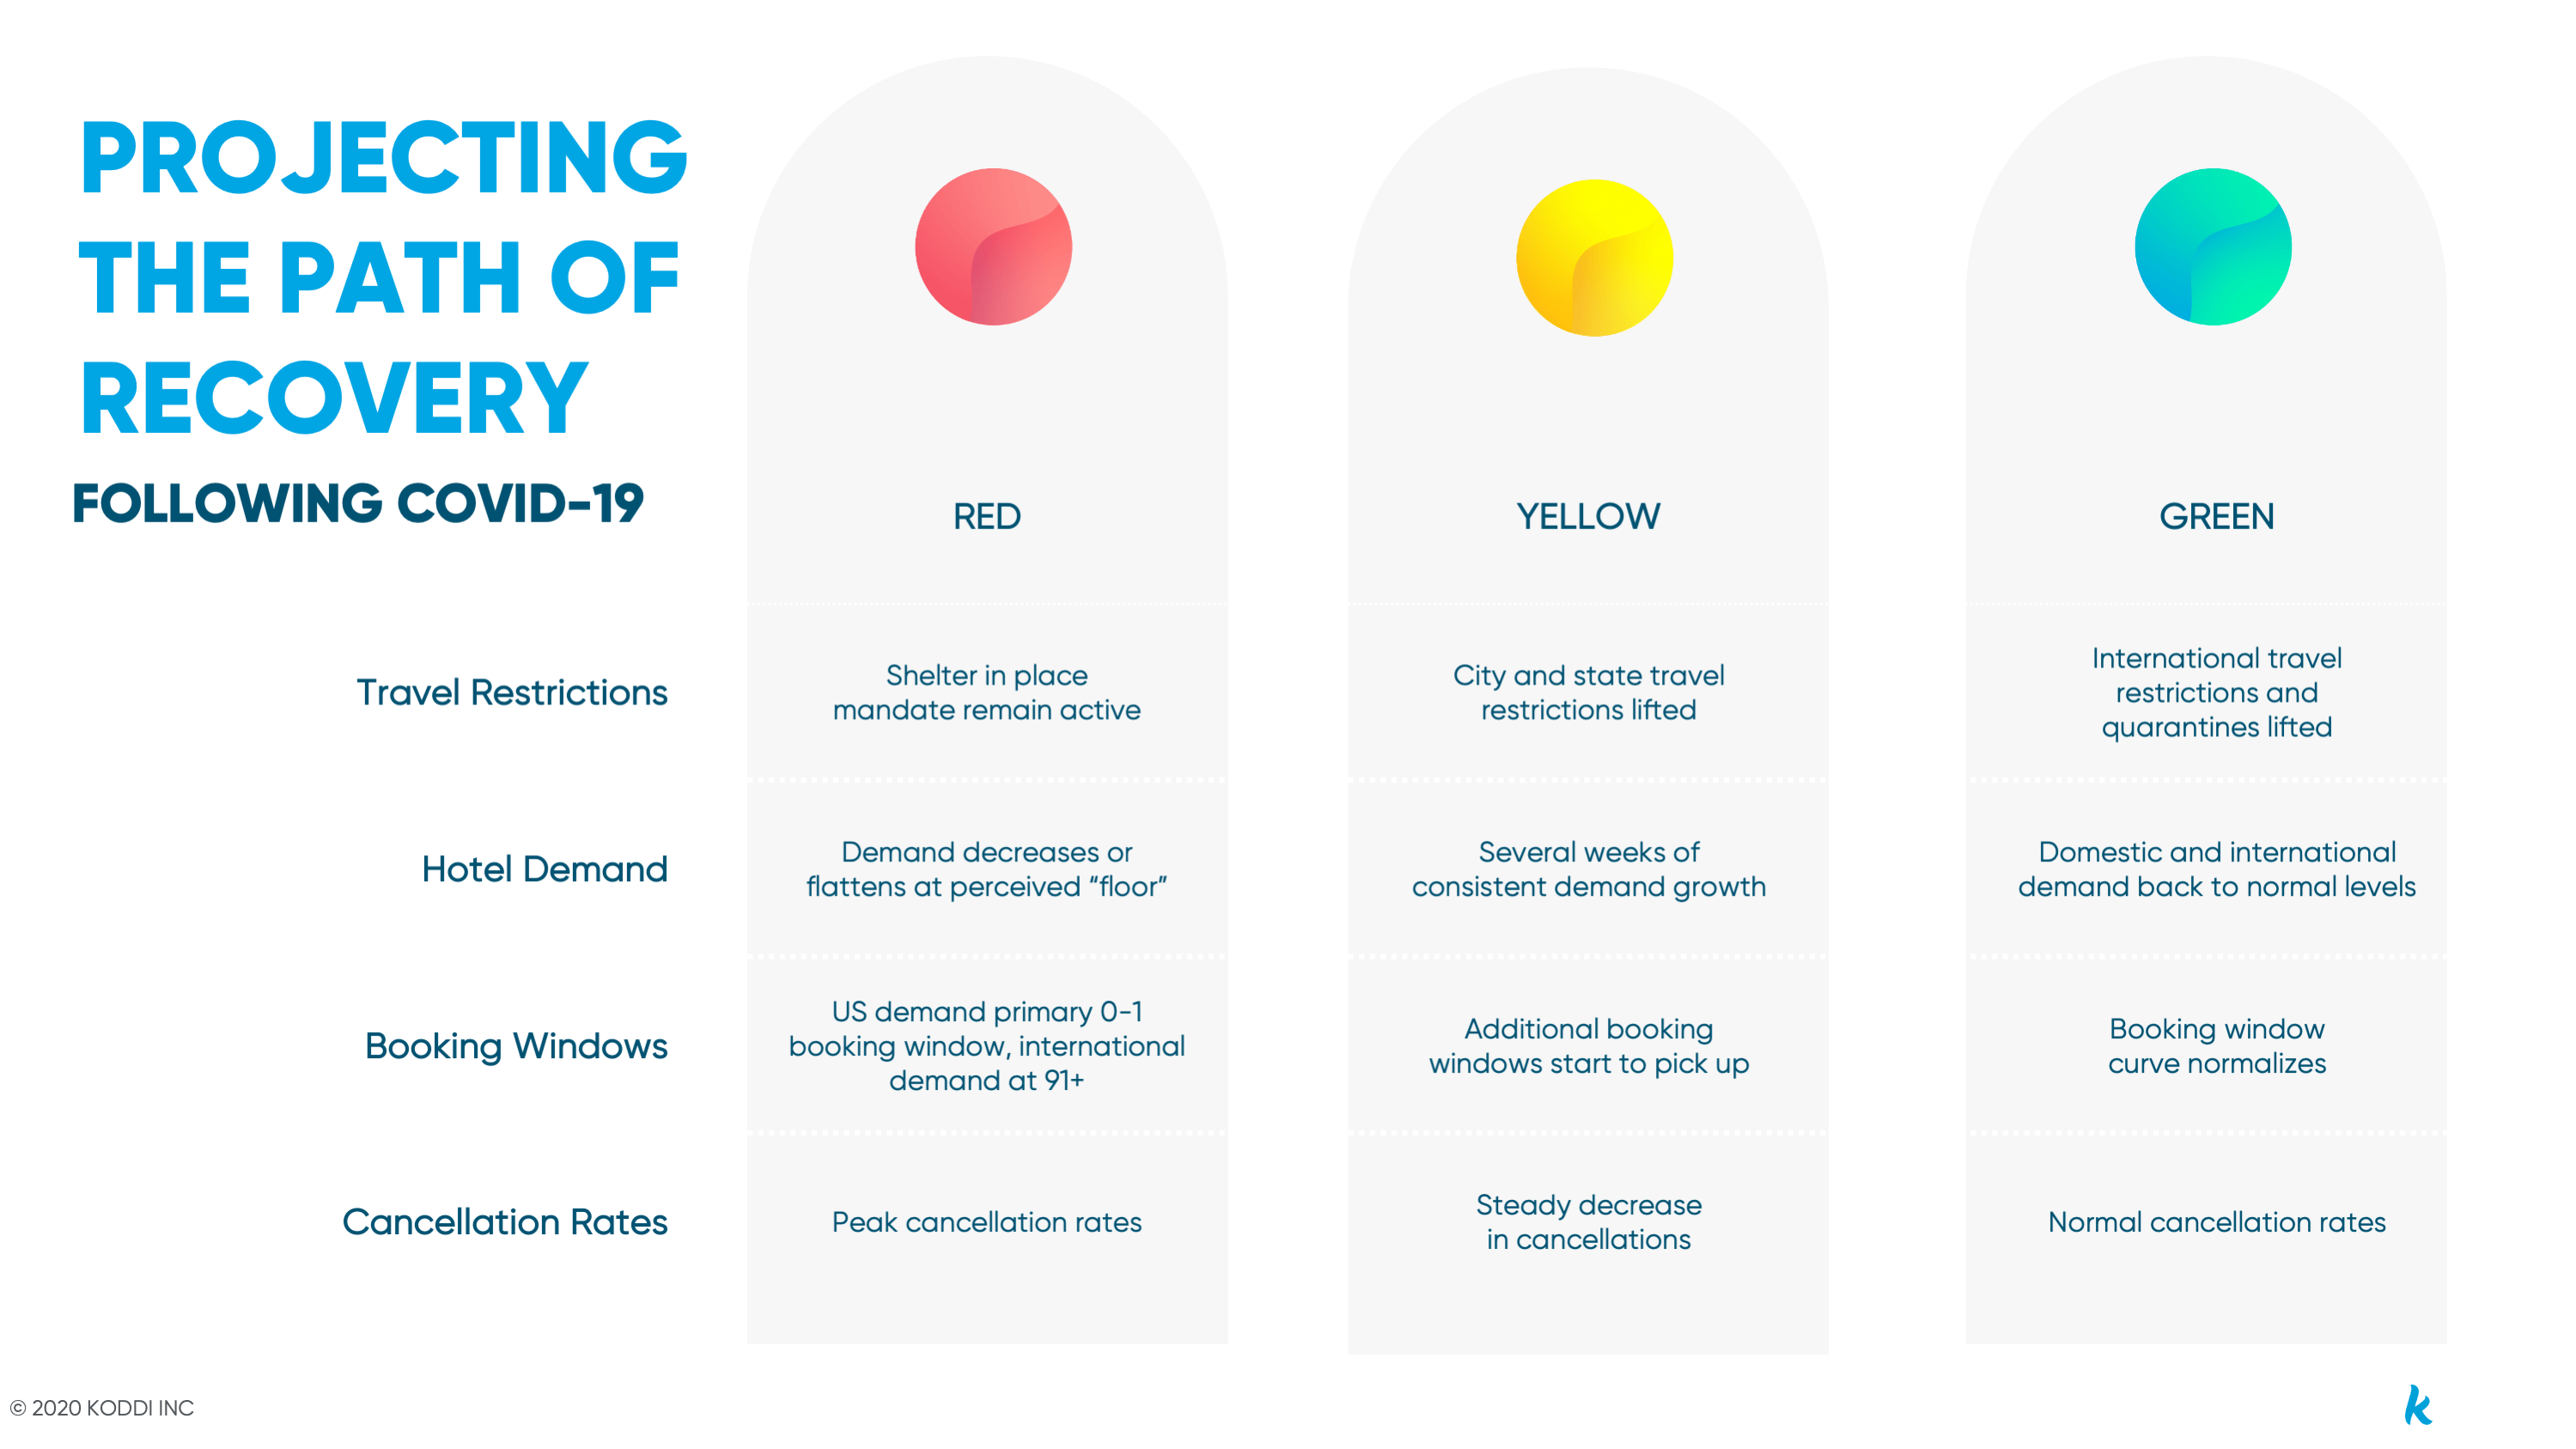
We view recovery as a matrix, analyzing four factors (travel restrictions, hotel demand, booking windows, and cancellation rates) against these three risk levels:
- Red – Reduce funding to minimize exposure and take advantage of reduced auction floors
- Yellow – Conservatively increase spend to capture demand at or above return goals
- Green – Increase spend across the funnel to grab click share and maximize revenue
While we hope to see an even progression with markets gradually moving from Red to Green, risk status isn’t linear. Any region can fall from yellow back to red due to another outbreak, or from green to yellow due to a new restriction put in place. In the chart below, we outline the key indicators at each stage of risk.
Recovery Stages By The Numbers
Without data, these stages are only theoretical. We are monitoring several data points daily to identify key opportunities for our clients. While every advertiser will have a unique threshold to define each risk level, the matrix above illustrates the conditions that must be met to achieve recovery and find “normal” again.
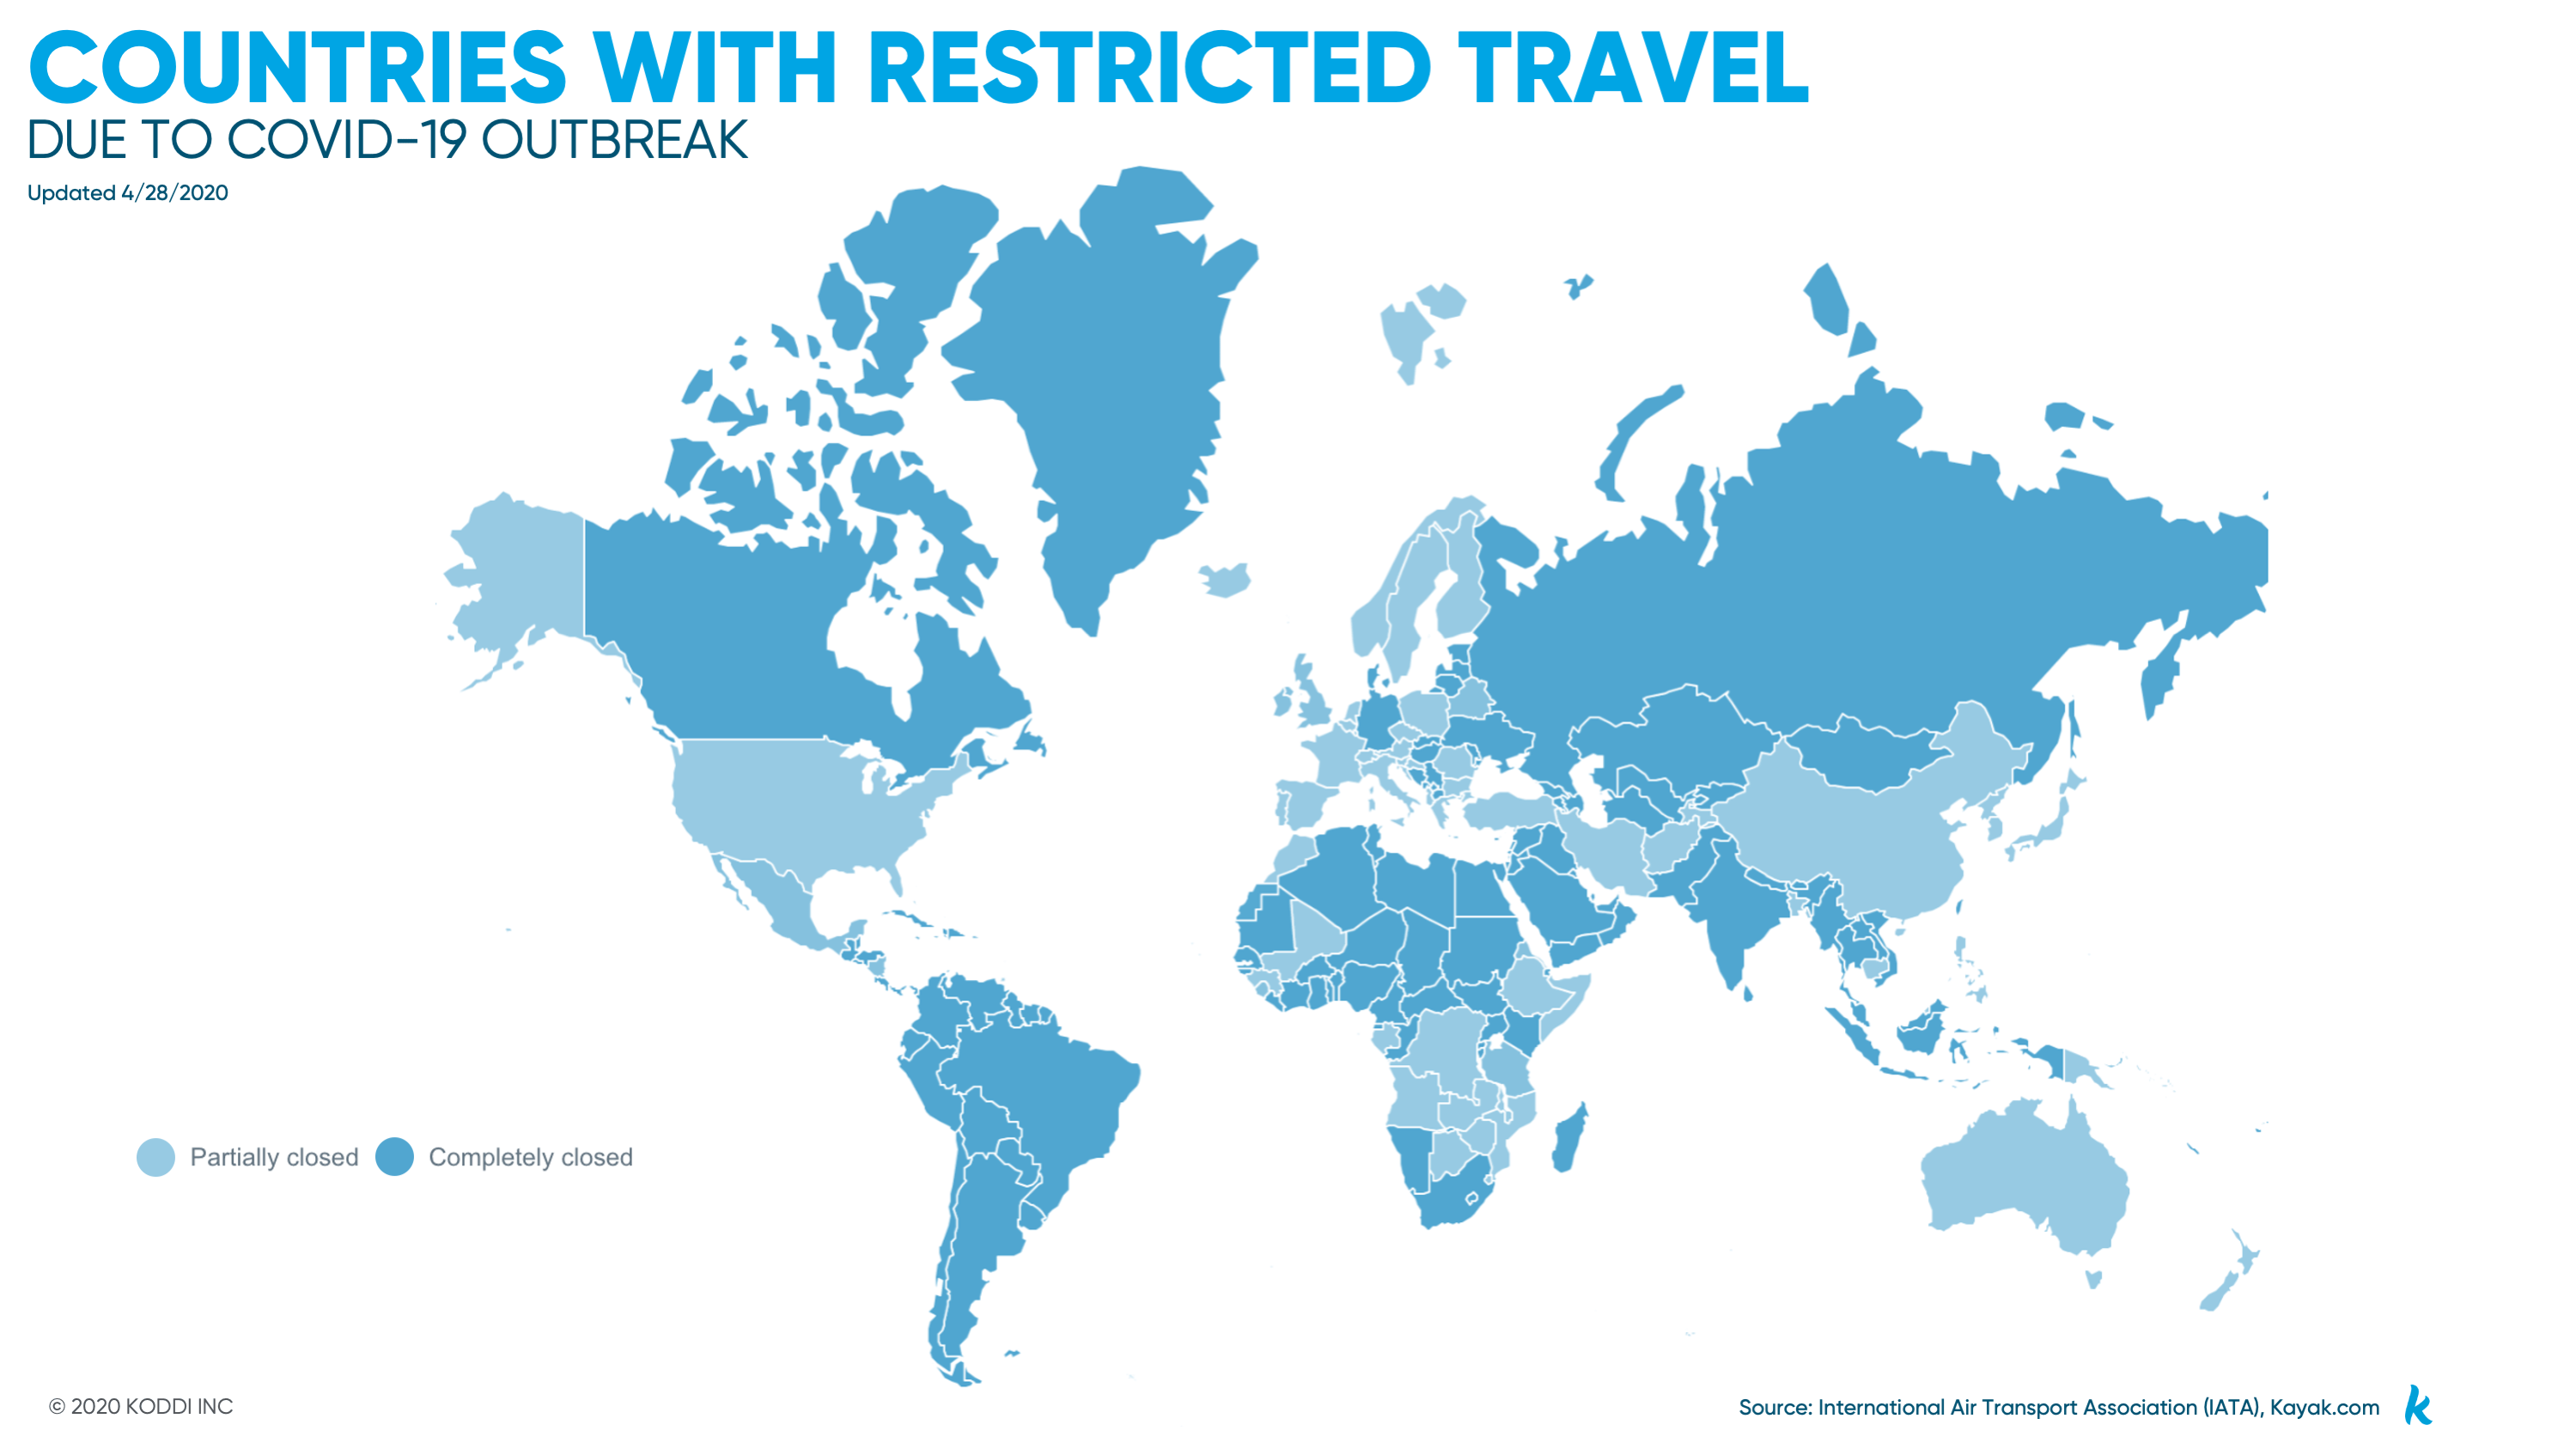
Changes to government regulations and the lifting of travel bans
We are closely monitoring travel mandates, stay-at-home orders, and country-wide lockdowns to determine when travel will be possible again and for what types of consumers (essential vs. leisure vs. business). We expect the recovery to happen market by market and region by region. As a result, marketing strategies will be more segmented than ever.
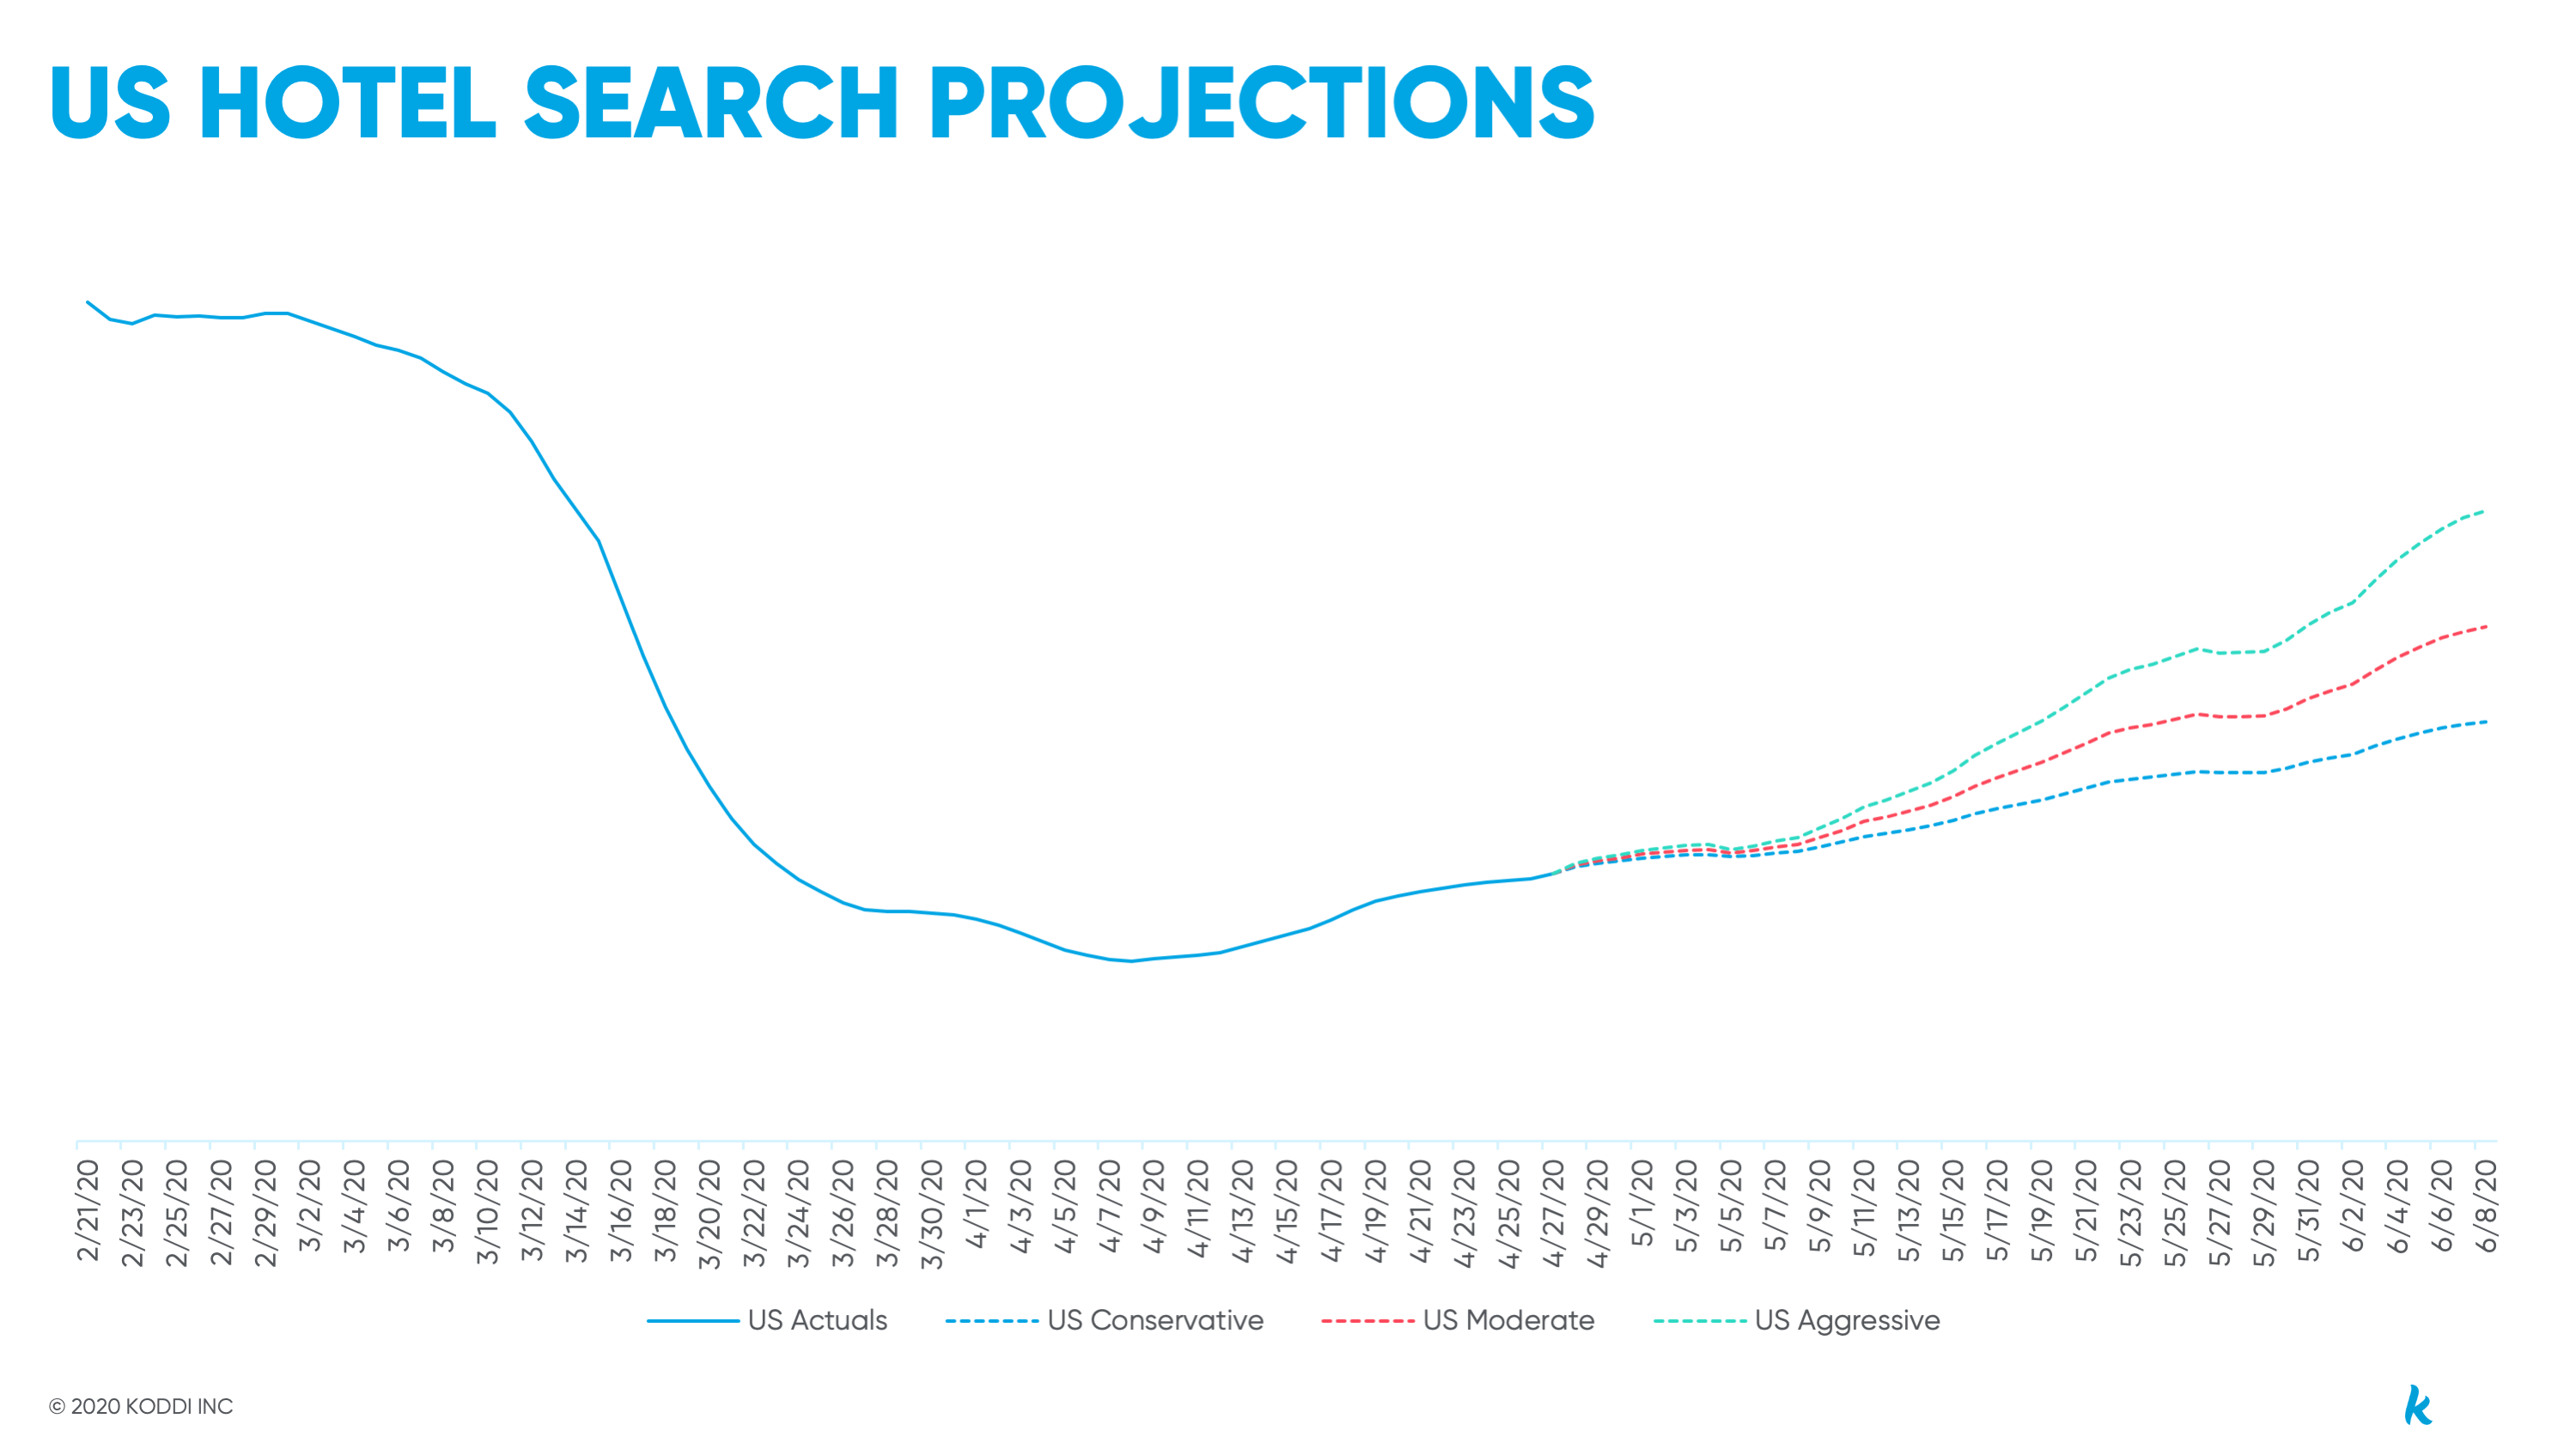
Change in demand
While any positive trend is encouraging, we are looking for consistent growth across various regions to determine whether demand is truly on the rise. The chart below shows projected U.S. travel demand through the end of 2020 as the global travel industry recovers. Based on all of the market and demand indicators, here are few recovery scenarios for the United States, barring a second wave of COVID-19. This forecast is subject to change as market conditions evolve.
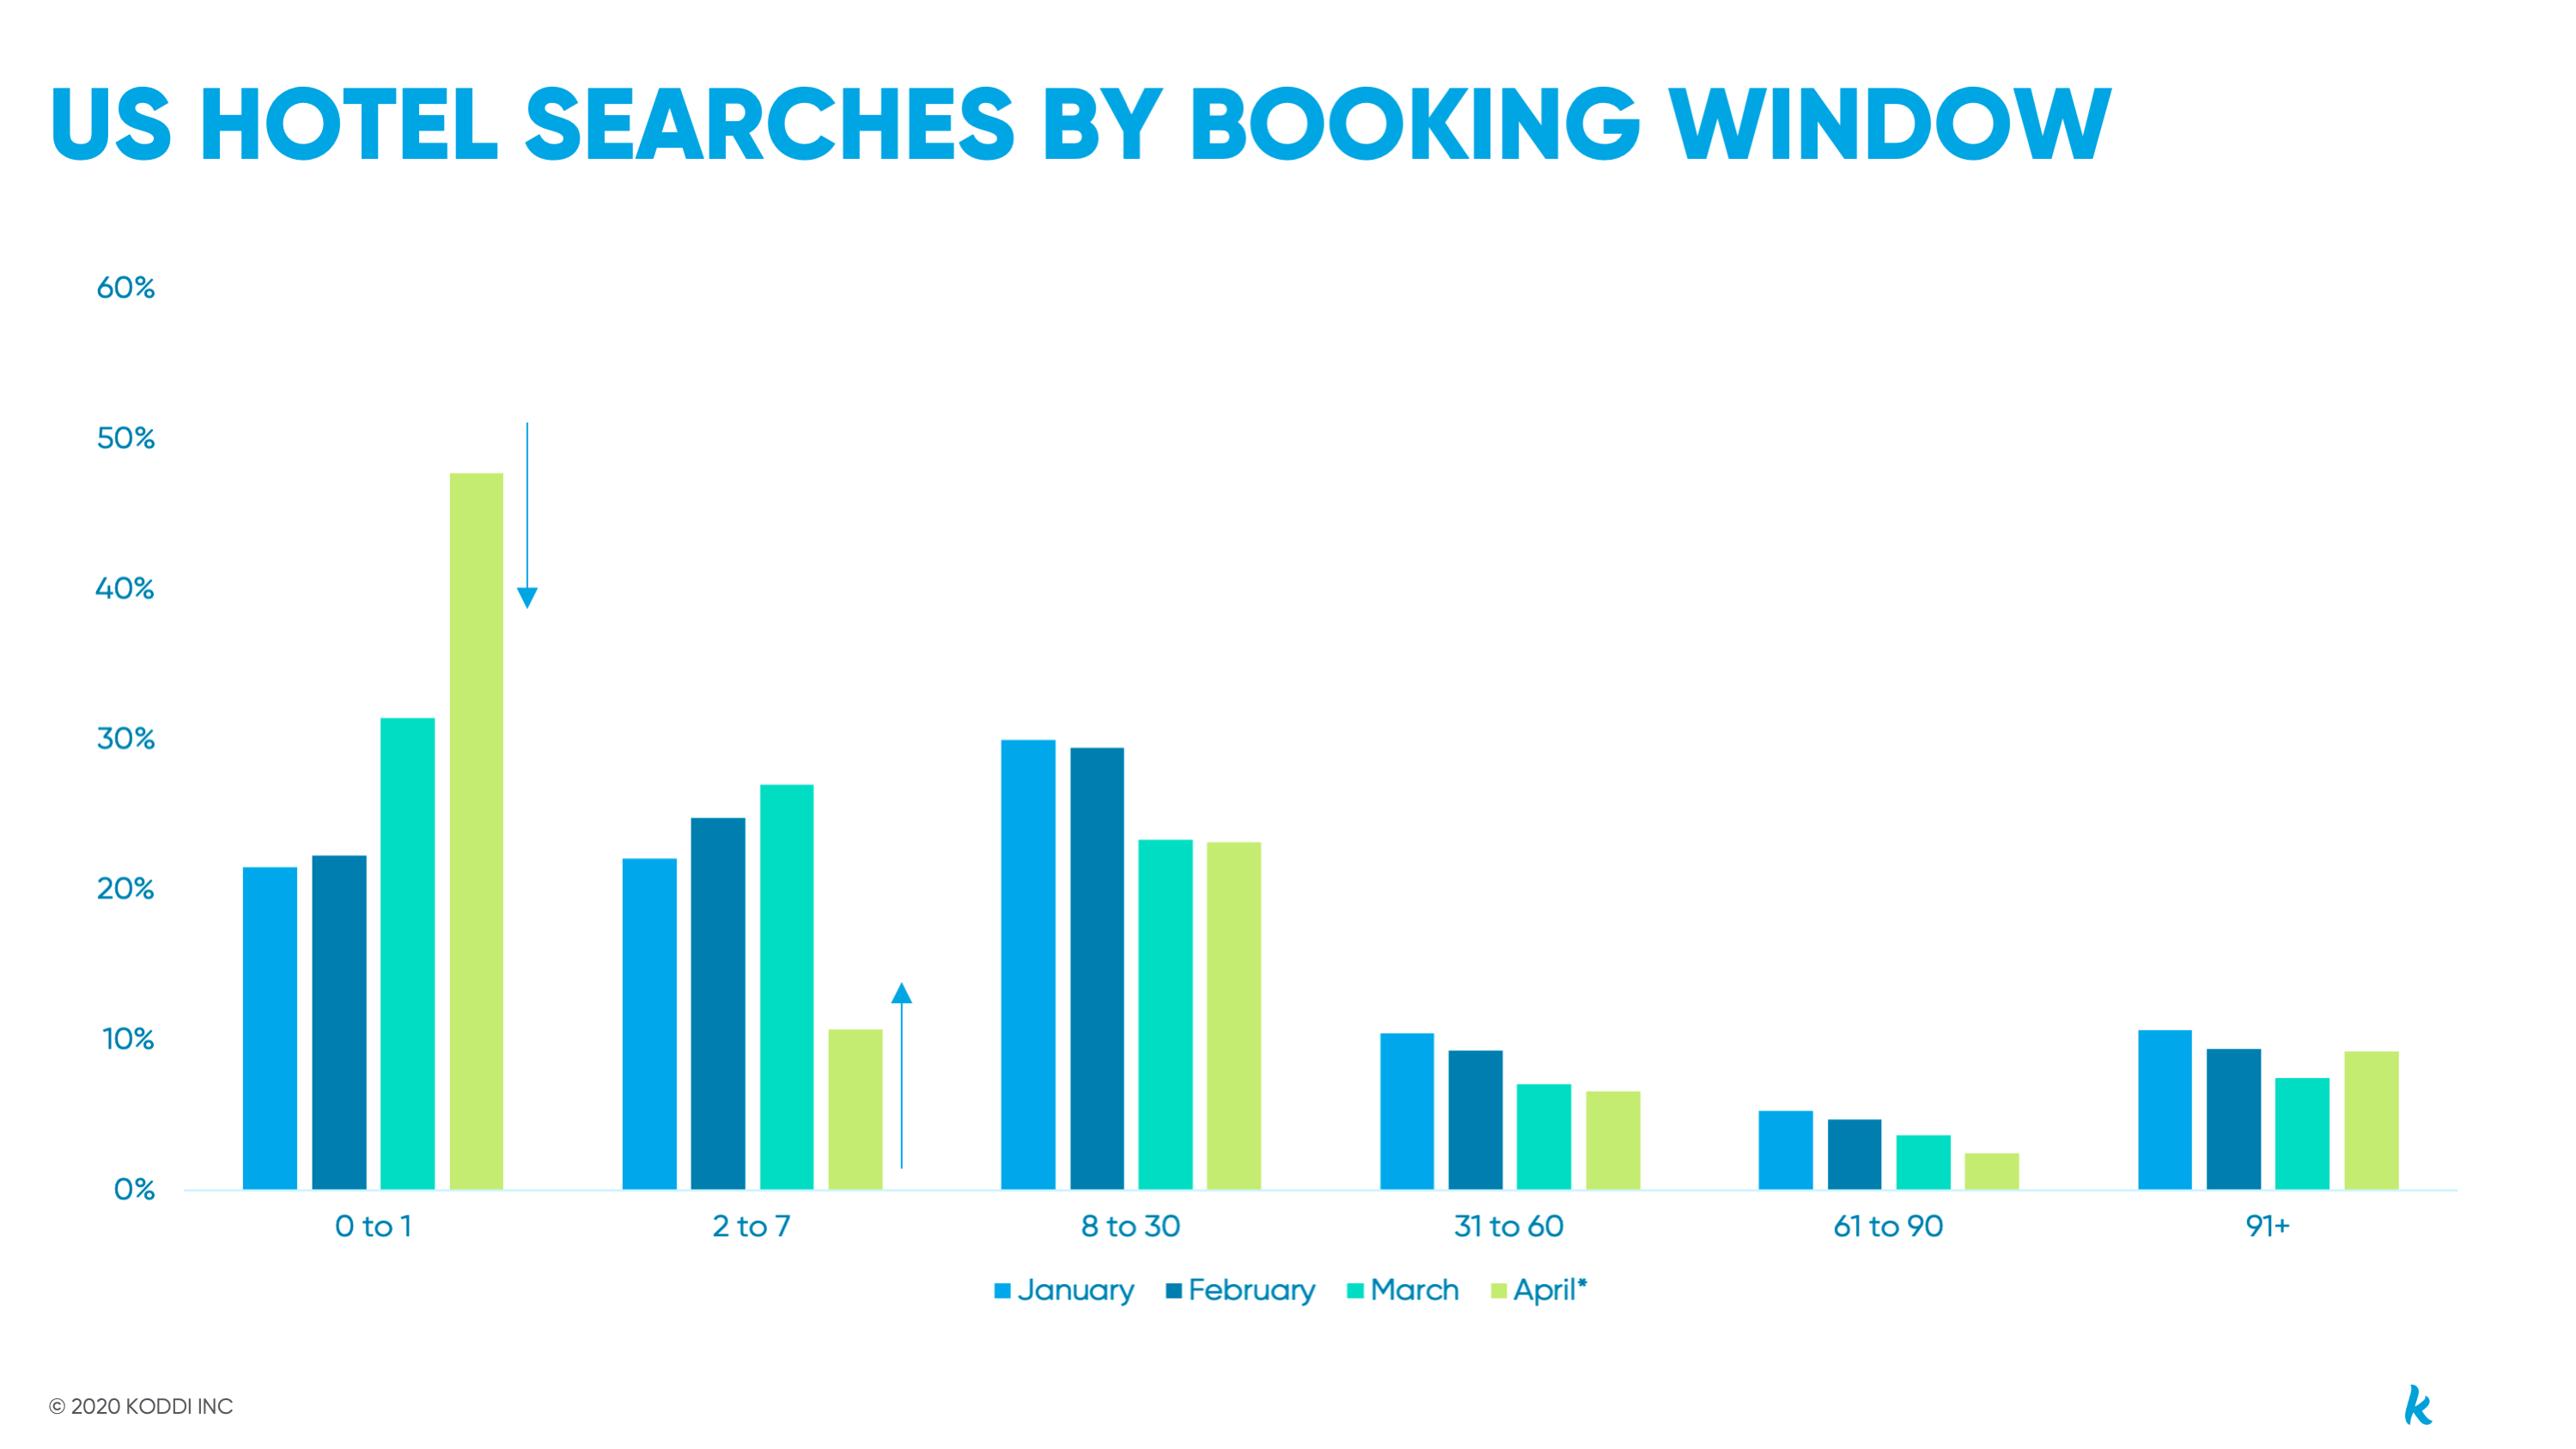
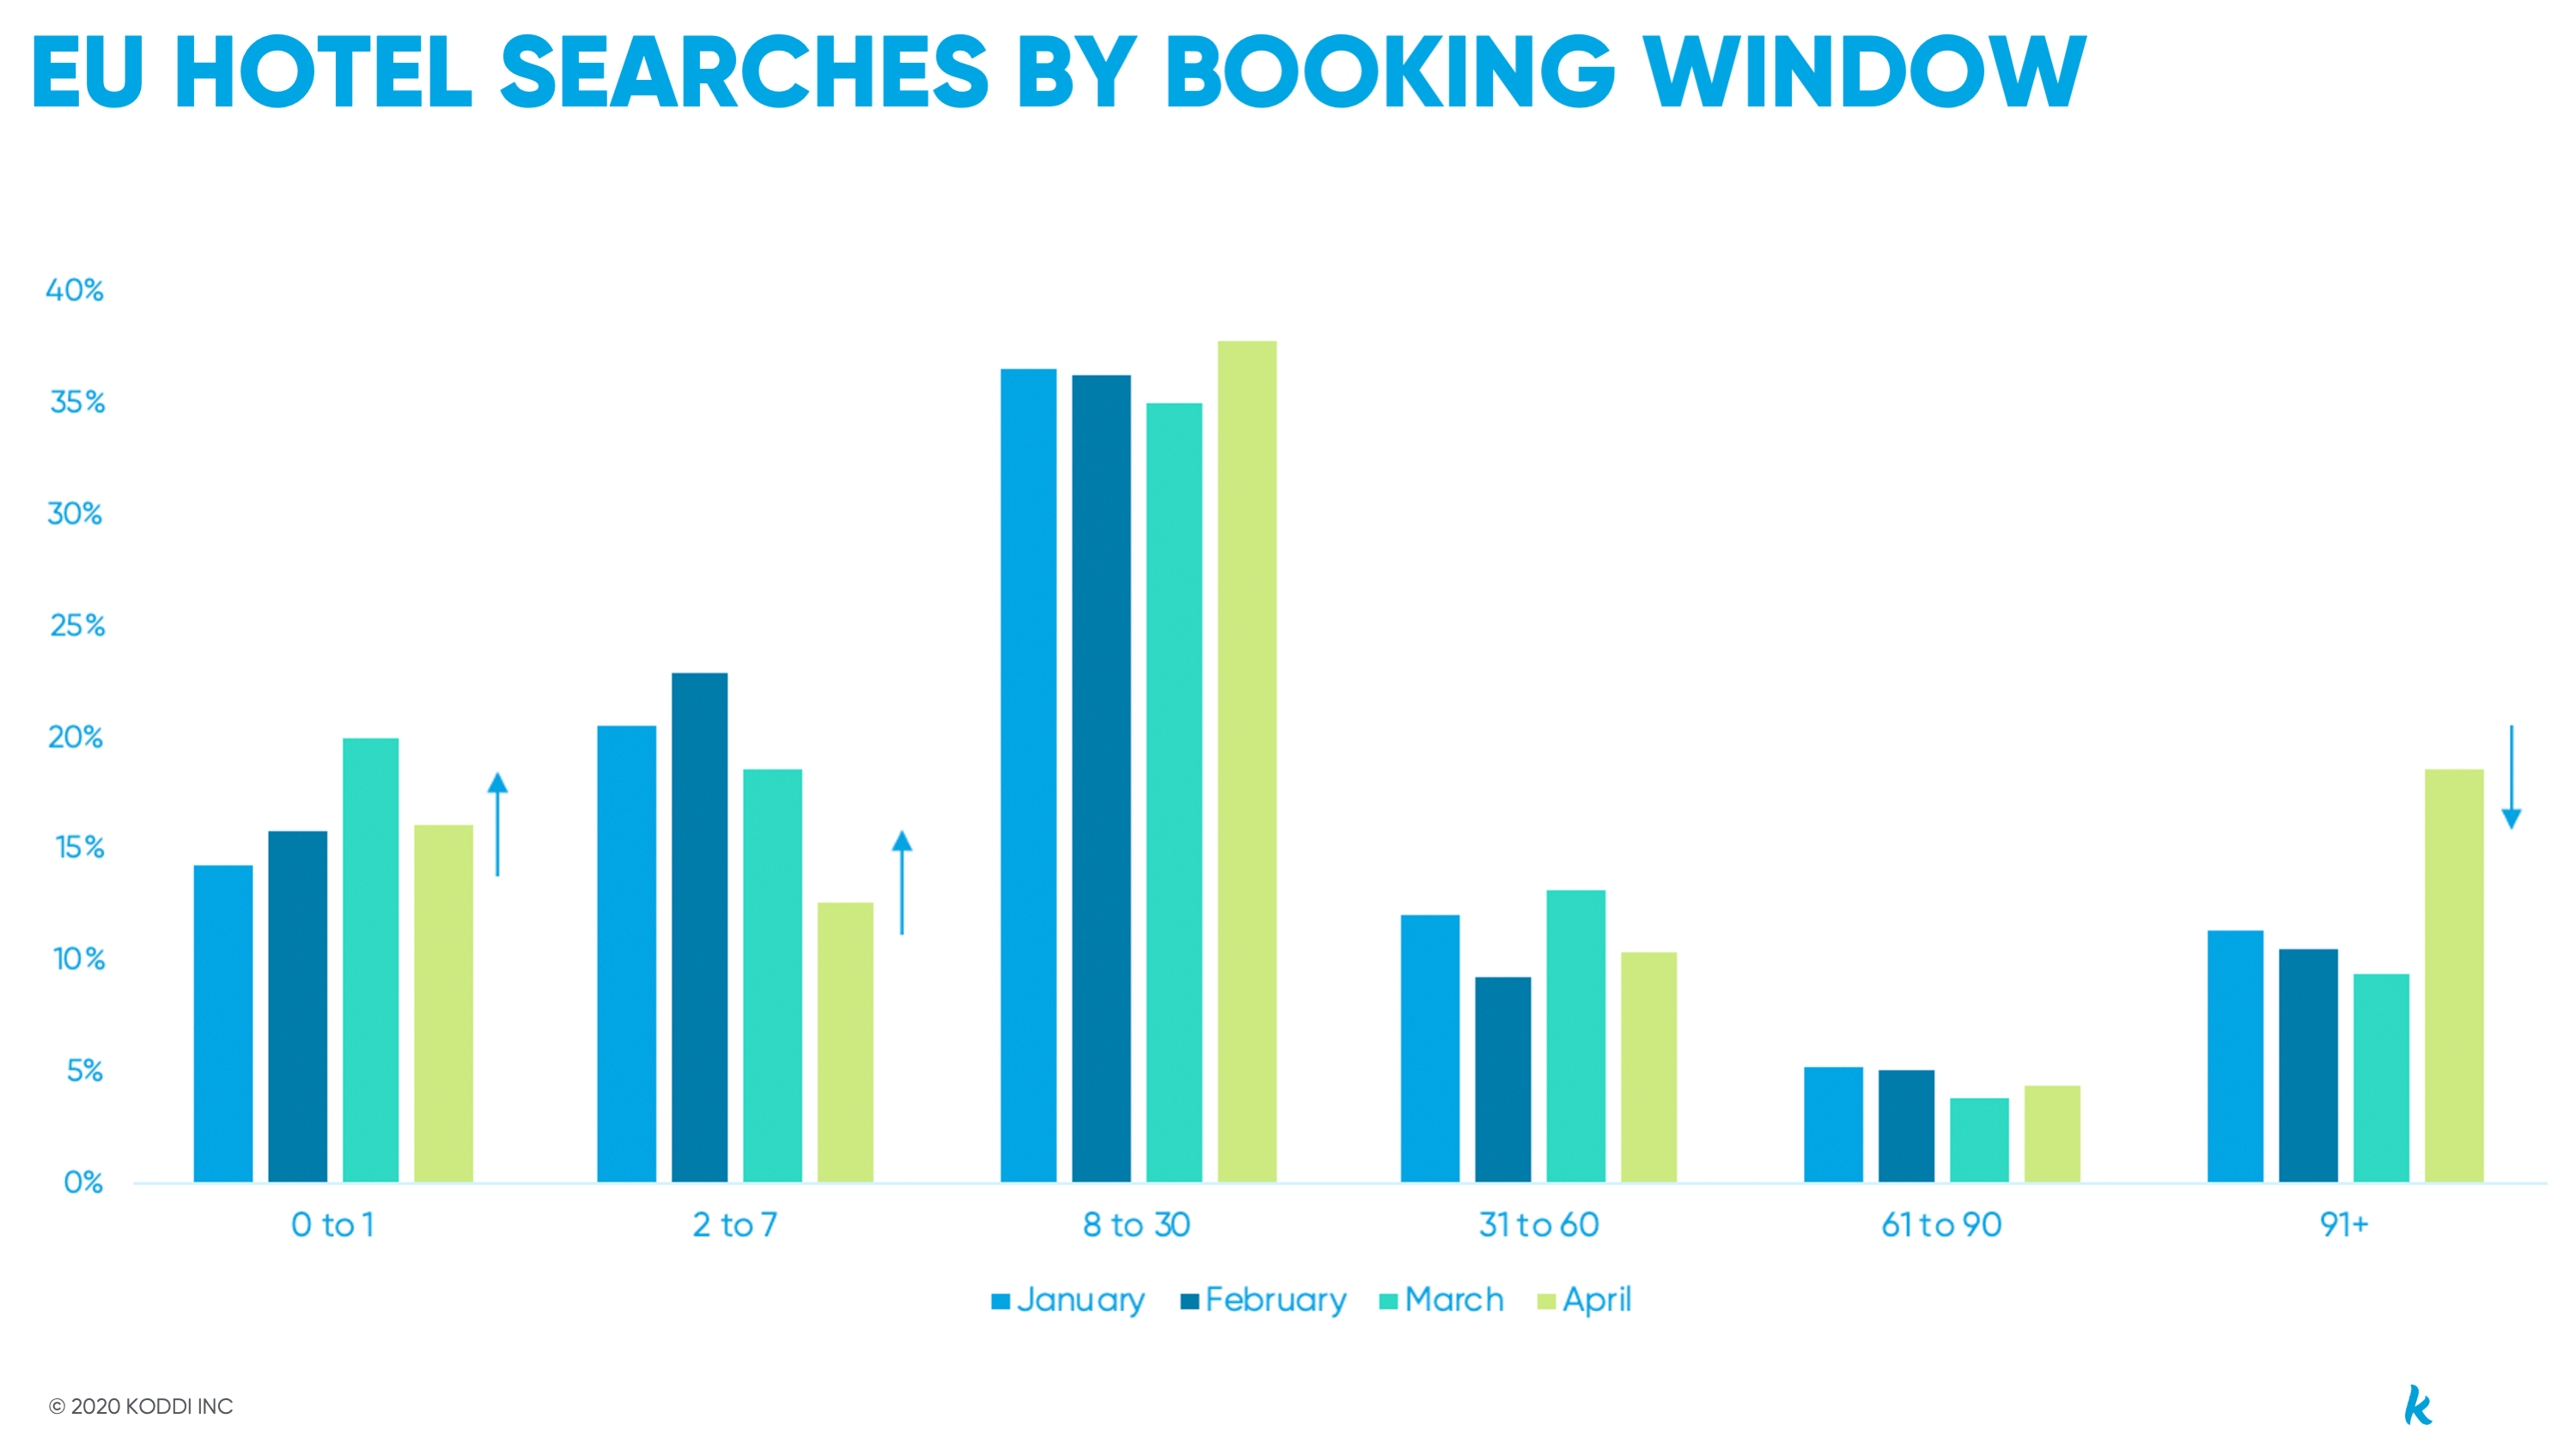
Normalization of advanced booking windows
The distribution of booking windows has shifted significantly throughout the pandemic, and it varies widely by region (as evident in the charts below, which compare booking windows in Europe to booking windows in the United States). Booking window distribution may not normalize completely for an extended period, but we should start to see some shifts during the recovery as travelers feel more confident planning future hotel stays.
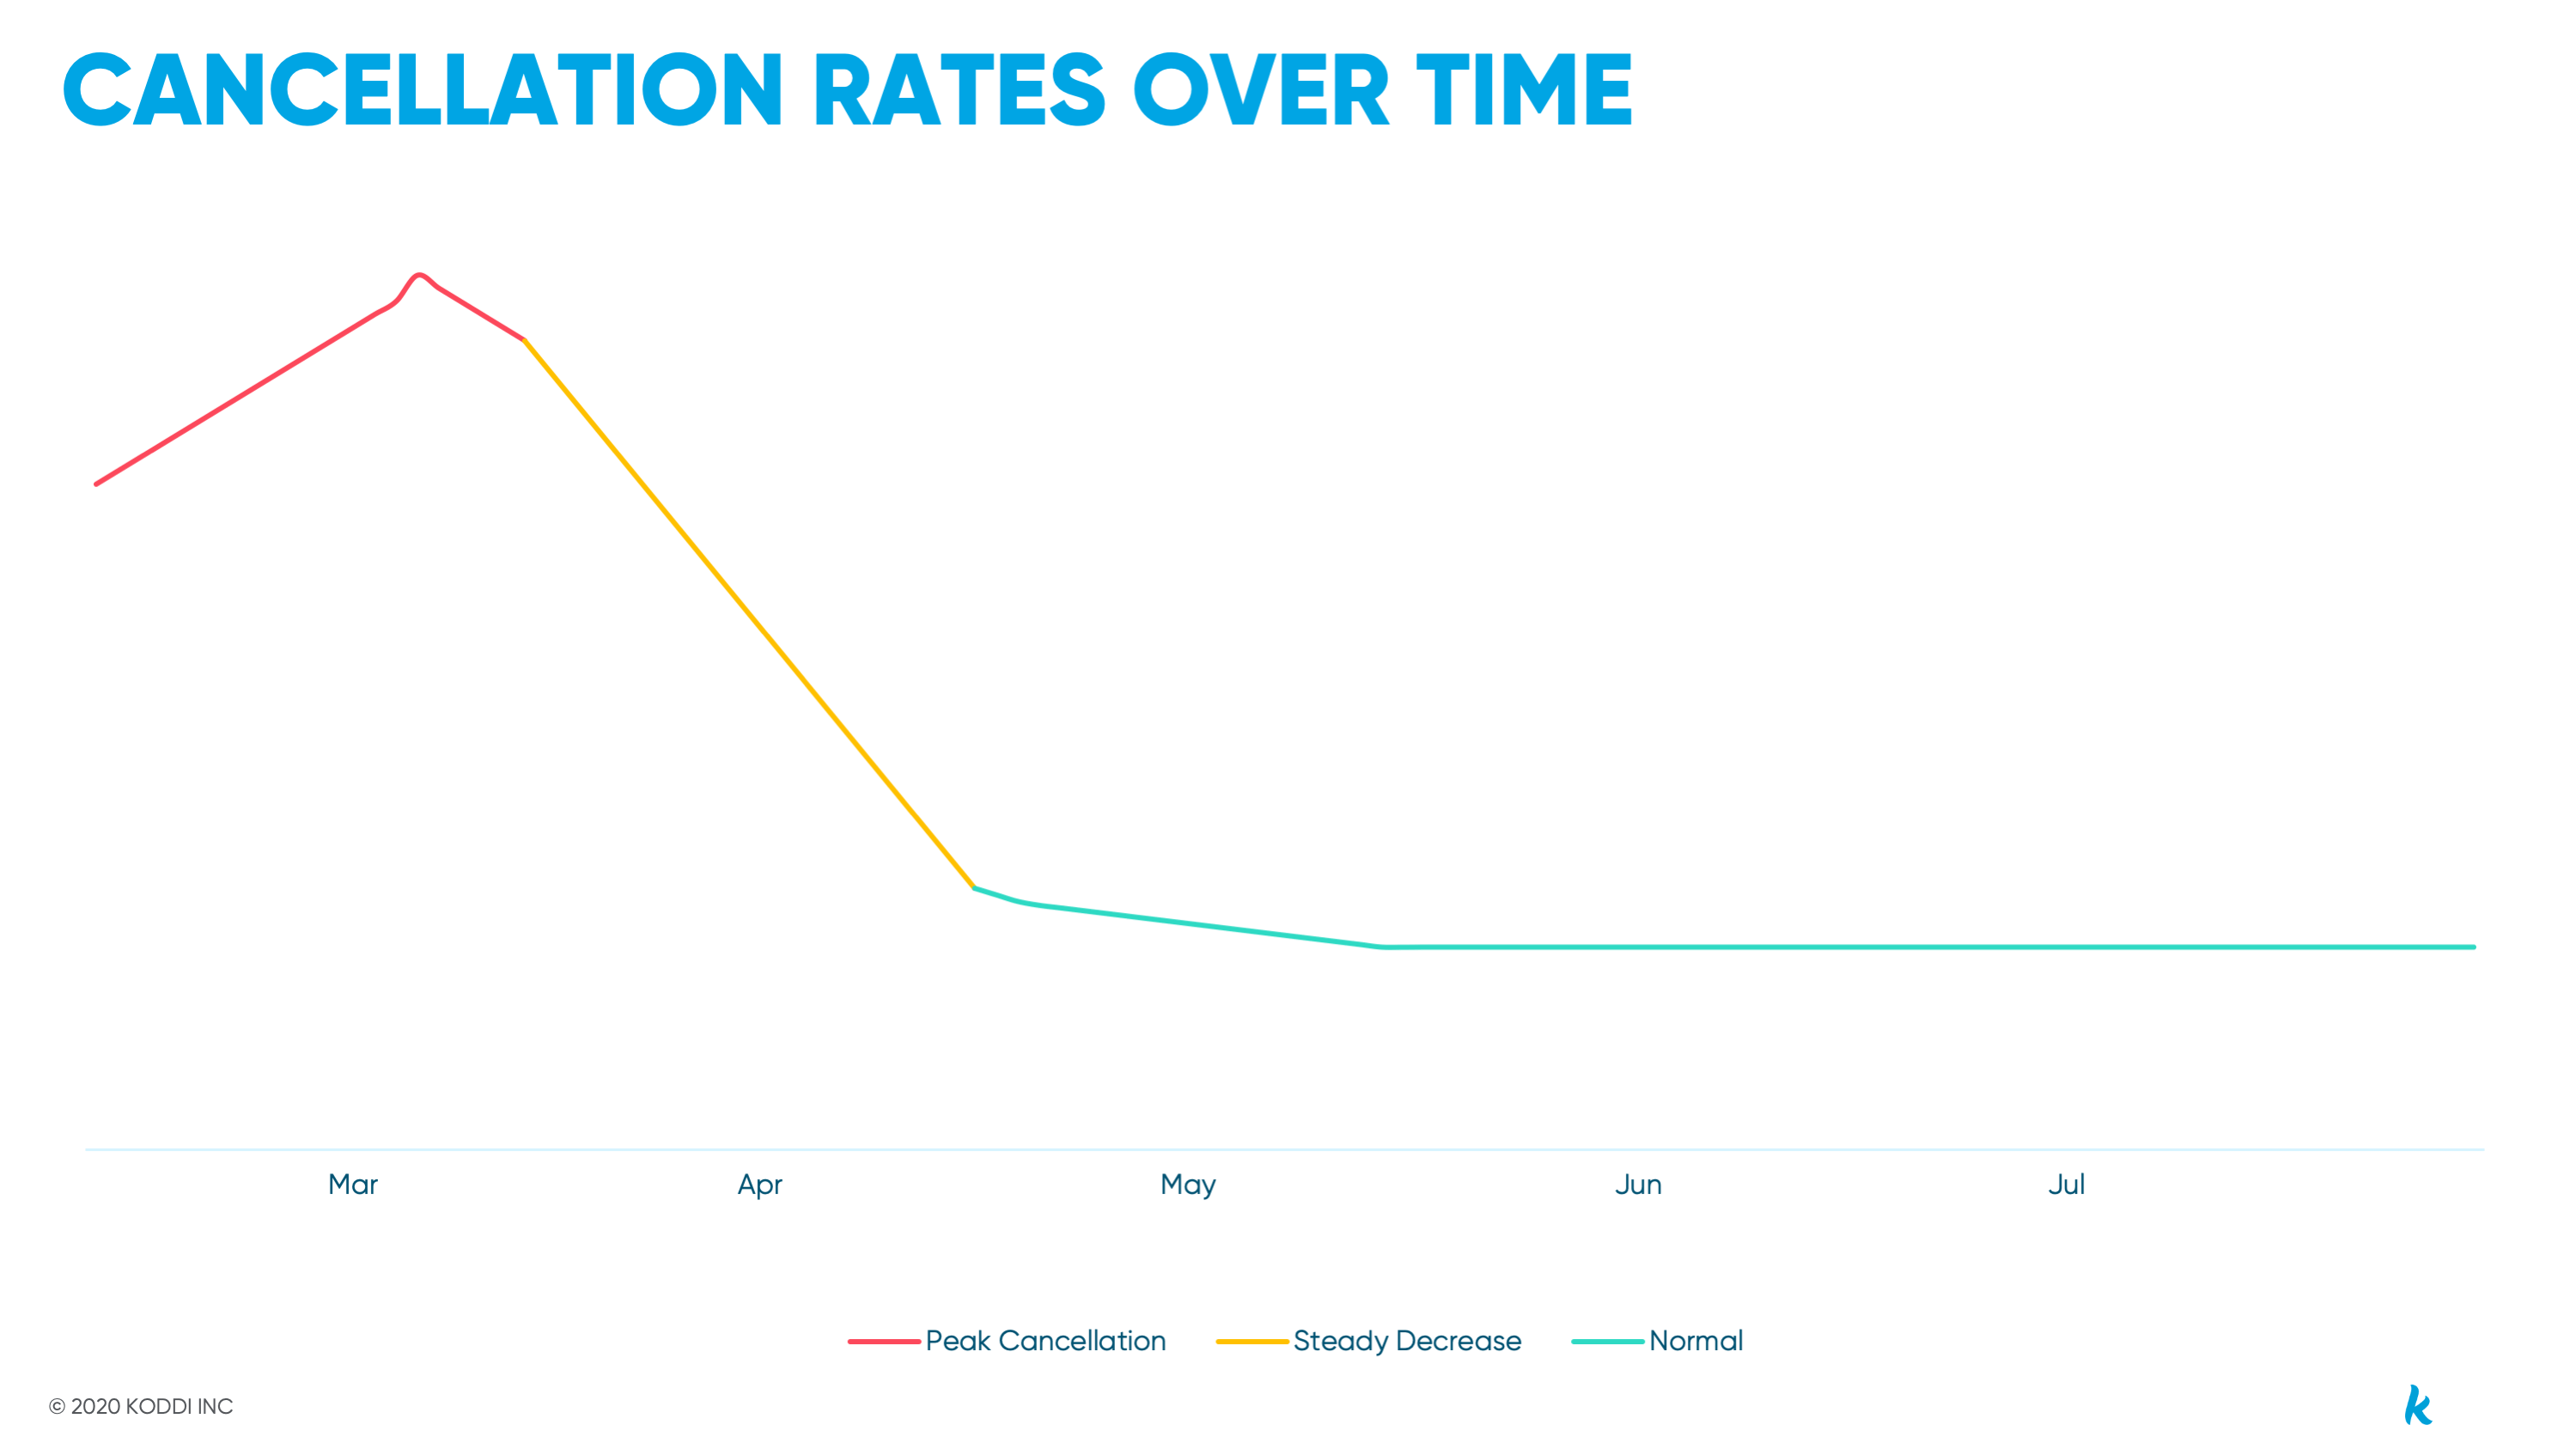
Improvements to cancellation rate
Cancellation rates peaked in March/April and have been trending downward since – largely due to natural stabilization as demand has decreased. We expect certain regions to recover first, given the path of the pandemic. To fully gauge recovery in these regions, we recognize the need for reliable indicators of not only changes in demand but also changes in actual stays. When analyzing cancellation rates, it is critical to consider booking windows as well as any regions or segments with particularly steep cancellations. These can be important factors for determining what regions should be prioritized (or deprioritized) as well as which bookings offer the best likelihood of a completed stay.
What This Means for You
Aggregated data, like the analyses we shared on hotel demand, cancellation rates, and advanced booking windows, are important reference points for assessing the market; however, the ultimate litmus test is real-time data based on your hotels and business insights. For example, internal demand data is a reliable indicator of which hotels and destinations are recovering best.
Advertisers who have continued to invest at conservative levels have a distinct advantage in understanding market trends, identifying recovery signals, and pressure testing those indicators with the realities of their business. Recovery timing and booking volume will vary based on business-specific factors, like hotel locations and property types, so the ability to act on your own data instead of market trends alone offers a significant advantage that ensures the best use of your budget.


