

There is no question about the importance of direct bookings for an effective online distribution strategy, but are you comparing your brand’s direct channel performance to the market?
NB: This is an extract article from a report produced by The Hotels Network, one of our Expert Partners
Benchmarking should be an essential part of every hotel’s direct growth strategy. Traditional hotel benchmarking tends to be based on occupancy and rates only, giving no visibility on how the end result came to be. We thought you needed more, that’s why we built BenchDirect: the first benchmarking platform for your direct channel.
Subscribe to our weekly newsletter and stay up to date
With the aim of sharing the insights and trends we have observed when analyzing BenchDirect data, we have published the first ever BenchDirect Insights Report. Focusing purely on direct bookings, it compares the direct channel performance of hotels by region in Q2 versus Q1 2021.
With this new report, hoteliers can now compare their performance along every step of the booking funnel, going beyond just occupancy and rates. In an effort to support the recovery of the hospitality industry, the report also includes commentary and key takeaways to provide more value and ensure hoteliers are able to use the insights to step up their direct booking channel strategy.
Looking at the evolution from Q1 to Q2 2021, there are some positive signs of recovery for the hotel industry. However, there are also clear opportunities for hotel brands to boost their direct bookings. Below are just a sample of the insights, please read the full report here.
- In terms of website traffic, the volume of unique visitors per room increased in Q2 versus Q1 across all regions, apart from Latin America and Southeast Asia. North America had the highest volume of unique visitors per room in both quarters, predominantly domestic.
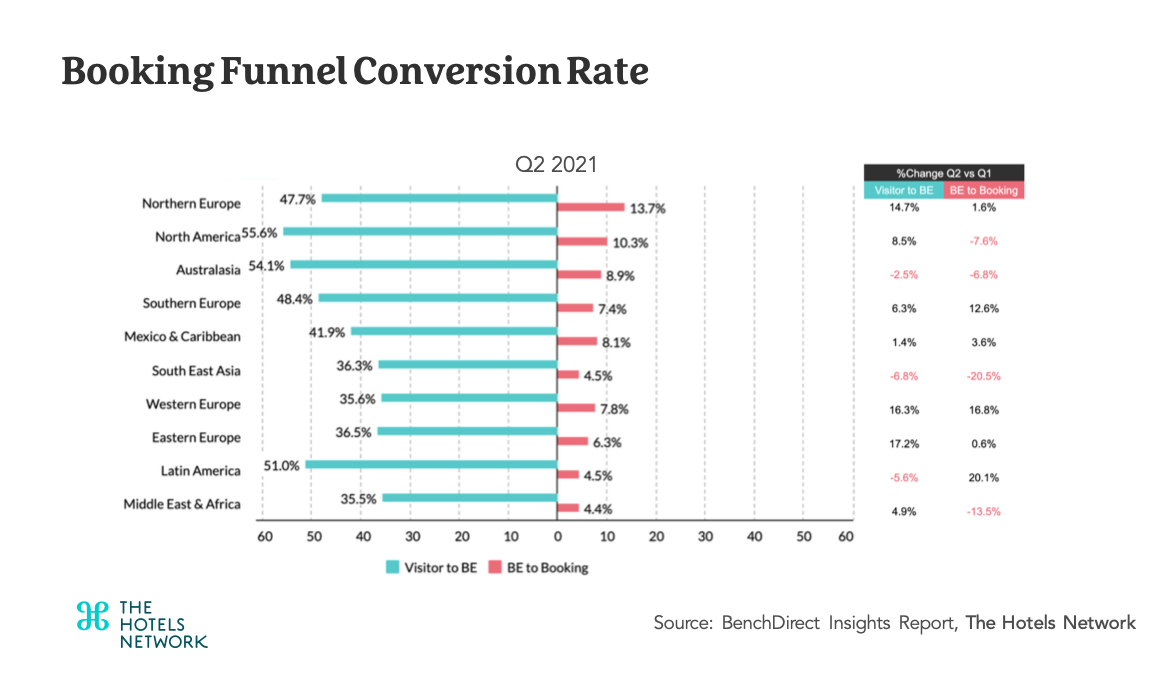
- Website conversion rates increased in the majority of regions, with the exception of Australasia, Middle East & Africa and Southeast Asia. Breaking down the booking funnel, in Q2 North America had the highest Visitor to Booking Engine conversion rate (55.6%) while Northern Europe had the highest Booking Engine to Booking conversion rate (13.7%).
- Price disparities continued to be an issue for hotel brands. Disparities frequency results varied widely by region, ranging from 13.1% in Southern Europe to 30.4% in Middle East & Africa while Disparities Amount had a much lower variance, from 9.7% to 12.9%.
- Mobile-first thinking is prevalent as mobile was the top device when it comes to traffic acquisition in almost all regions, while desktop was the preferred device when completing the booking process.
- Despite some decreases in volume in Q2, Search was still the dominant source in terms of traffic acquisition for hotels. Search conversion rates increased in Q2 across all regions except Southeast Asia and Australasia.
Overall, hotel website traffic increased in Q2 2021 but with around 97% of visitors leaving hotel websites without booking, there is a huge opportunity for hotels to increase their direct bookings by focusing on improving conversion rates. Understanding how your properties are performing compared to the market should be an essential part of every brand’s direct channel growth strategy.
BenchDirect provides these benchmarking insights and is FREE for hoteliers, FOREVER.
Download the full BenchDirect Insights Report here


