Driven by robust leisure demand and rapid rate growth, in 2022 the global hotel industry almost fully recovered from the pandemic downturn. However, there was one major exception: Asia.
NB: This is an article from d-edge
According to STR, in 2022 hotels in Europe grew their average daily rate (ADR) by 18.5% relative to 2019 and revenue per available room (RevPAR) by 6.1%, whereas occupancy lagged by 10.5%. Meanwhile, in Asia, where travel restrictions remained in place long after being lifted in other regions, ADR fell 9.9% short of 2019 levels, RevPAR was down 31.2% and occupancy was down 23.7%.
Subscribe to our weekly newsletter and stay up to date
Nevertheless, Asia is poised for a sharp rebound in 2023.
In this report, we draw from our data set of independent hotels and small to medium-sized hotel groups in Europe and Asia to analyse distribution trends from four years of online booking data spanning from 2019 through 2022. We also provide a peek at 2023 booking trends with a look at January data.
We break down performance by key distribution metrics, including gross and average booking revenue, average rate, length of stay, channel market share, cancellation rates and lead times. And we share strategies for leveraging shifting travel patterns to grow revenue and outperform competitors in 2023.
In the following sections, we look at booking value (revenue), which provides greater insight into hotel performance than the volume of bookings or room nights.
Key Findings
Before we wade into the data, here are the highlights from our analysis.
- In 2022, gross booking revenue was up 49% in Europe relative to 2019.
- The average daily rate (ADR) in Europe soared 25% above 2019 levels in 2022 and increased by 6% in Asia.
- After gaining substantial market share from OTAs during the pandemic, hotel direct booking revenue lost some ground in 2022 but still managed to hold on to increases of 5 points in Europe and 19 points in Asia relative to 2019.
- Booking Holdings maintained its dominant market share of OTA bookings in 2022 but generated the lowest average length of stay and the highest cancellation rate of the major online booking channels.
- Expedia Group has lost significant market share in both Europe and Asia, but volume is expected to pick up in 2023 as international travel gains momentum.
- After spiking during the pandemic, cancellation rates returned to near-normal levels in 2022.
- Data from January 2023 shows a promising start to the year, with significant increases in average booking value, ADR and length of stay in both regions.
Definitions: Key Hotel Distribution Metrics
Here’s a quick reference guide to the key metrics in this report:
- Gross booking value (GBV): Total revenue from all online booking channels, fewer cancellations.
- Average booking value (ABV): The average amount guests pay per online booking, also called average transaction price (ATP). It is calculated by multiplying the average daily rate by the average length of stay.
- Average daily rate (ADR): The average price guests pay for a room per night.
- Average length of stay (ALOS): The average number of nights guests stay per booking.
- Lead time: The average number of days prior to the arrival date that guests make bookings. This can also be referred to as “booking window”.
- Direct channel: Direct bookings made through hotel brand websites.
- OTA channel: Bookings made through online travel agencies.
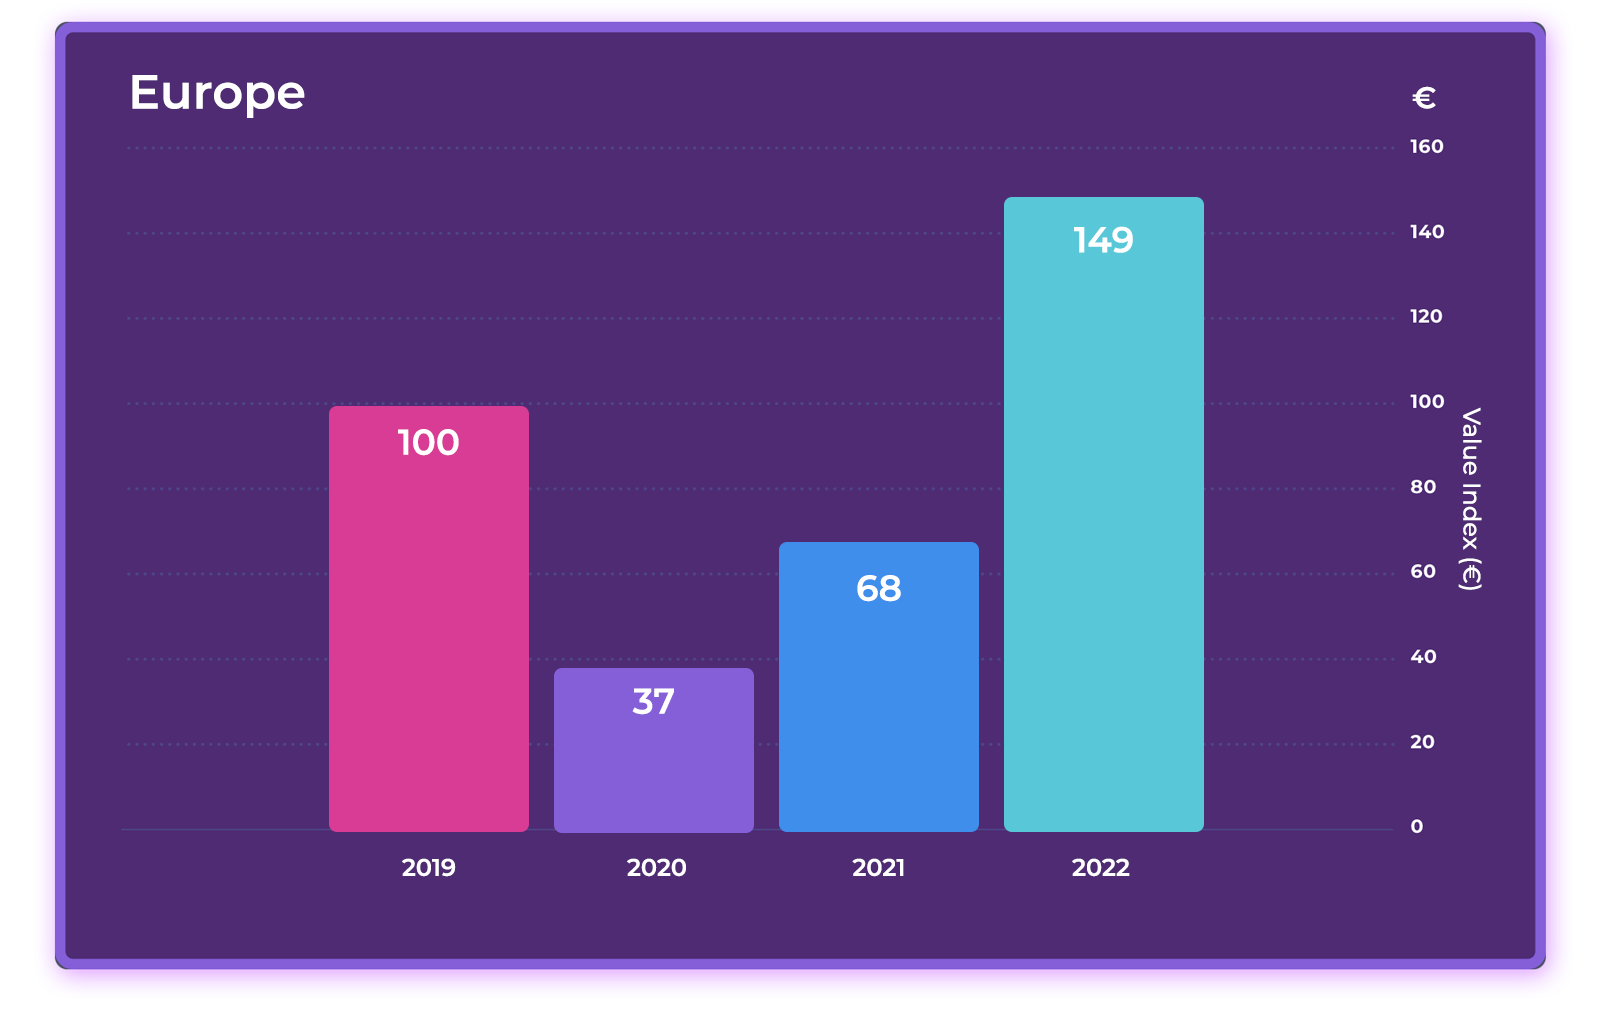
Gross Booking Value: Hotels in Europe and Asia Surpass 2019 Levels
Gross Booking Value (GBV) – Indexed to 2019
In Europe, the pace of recovery experienced a setback in the first quarter of 2022 after the Omicron variant hit, but by mid-year most travel restrictions had been lifted. A boom in leisure travel followed and was supplemented by growing demand for business travel to end the year with a strong finish. Overall, hotels in our data set in Europe clocked an impressive 49% growth in gross booking value (GBV) relative to 2019.