
Google loves making changes to its search algorithm and associated tools. And in November of 2018, Google’s latest speed update affected the PageSpeed Insights tool. The victims – slow websites.
What happened on November 12, 2018:
When it comes to your website, you think about user experience, page speed and performance. Faster pages offer better user experience, improve conversions and reduce bounce rate. For years, marketers have been relying on Google’s PageSpeed Insights (PSI) tool to measure their website’s performance and follow the recommendations. So, when Google made a drastic core update to the PageSpeed Insights algorithm, it drove the digital marketing world into frenzy.
Flashback 2018 – Here’s how the site’s PageSpeed Insights score for mobile looked:

After the November 12, 2018 update – here’s how the score looks now:
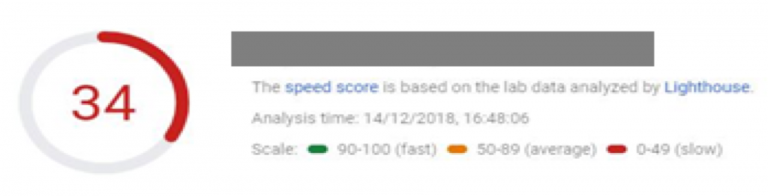
You read it right! From 99/100 to 34/100. From ‘Fast’ and ‘Good’ to ‘Slow’. And, this was not an exception. Many digitally creative and SEO optimized sites took a blow from this update.
And what we observed was
As our researchers and SEO experts started digging deep and simulated scenarios (by making incremental changes to websites and measuring scores), what came out was interesting.
The good news: The new PageSpeed Insights tool results are action oriented – they tell you how the plugins, themes, internal scripts and other third-party services are impacting your speed and what you should do to improve it.
The bad news: Third party scripts and some of the recommendations are not in your control. Yet, they affect your scores significantly.
The previous version of PageSpeed Insights (Jan 2018 update) used data from the Chrome User Experience Report. The tool then showed you how fast your pages load based on real user data. It did not measure performance accurately and marketers started turning to other reliable tools like Webpagetest, Gtmetrix, and Pingdom.
With the current November 2018 update, PageSpeed Insights version 5 has made a colossal shift – it has inducted Lighthouse as its analysis engine. Lighthouse computes a website’s Performance Score from the following metrics* that it generates:
- First Contentful Paint (FCP): Time taken by a browser to render the first bit of content from the DOM
- First Meaningful Paint: Time at which the user feels that the primary content of the page is visible
- Speed Index: Average time at which visible parts of the page are displayed
- First CPU Idle: (Previously called First Interactive) when a page is minimally interactive – most UI elements are interactive, and page responds to user inputs
- Time to Interactive: How long it takes a page to become interactive – displays useful content, event handlers registered for visible elements, responds to user interactions within 50 milliseconds
- Estimated Input Latency: Input responsiveness of the application
*Explanations derived from developers.google.com
Lighthouse uses both lab & field data:
- Lab data to analyse current page on an emulated mobile network to compute the above 6 metrics and arrive at the thereby Performance Score for mobile
- Field data collected in the last 30 days
The old scores do not matter anymore, and pages need to be retested.
The Obvious. Not so obvious. And the hidden.
When Google announced the PageSpeed Insights update, they made certain things obvious. However, a deeper analysis revealed more.
First, the Obvious ones:


