
The summer is in full swing with U.S. hotel occupancy rising to 70.6% for the week ending 11 June 2022, which was the highest level of the year and the third highest since the start of the pandemic.
NB: This is an article from STR
The previous two pandemic-era occupancy records were achieved in July 2021. Weekday (Monday-Wednesday) occupancy (70.1%) also reached its highest level since the start of the pandemic as all three days individually also saw their best values of the pandemic-era. Average daily rate (ADR) hit the second highest nominal level (US$155) since STR began tracking weekly data in 2000. ADR was up 23% versus a year ago and 15% when compared with 2019.
Subscribe to our weekly newsletter and stay up to date
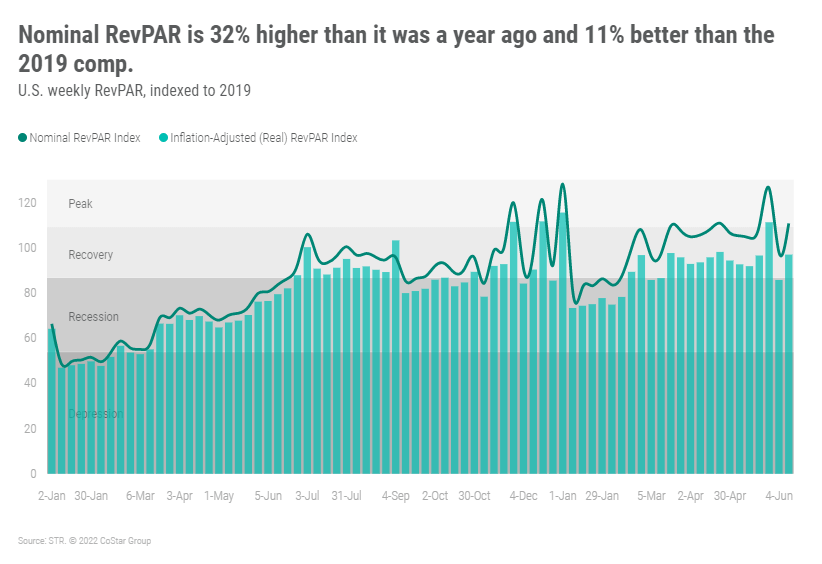
Nominal revenue per available room (RevPAR) reached the highest weekly level ever recorded (US$110), topping the previous high achieved in July 2018. Nominal RevPAR was 32% higher than a year ago and 11% better than in 2019.
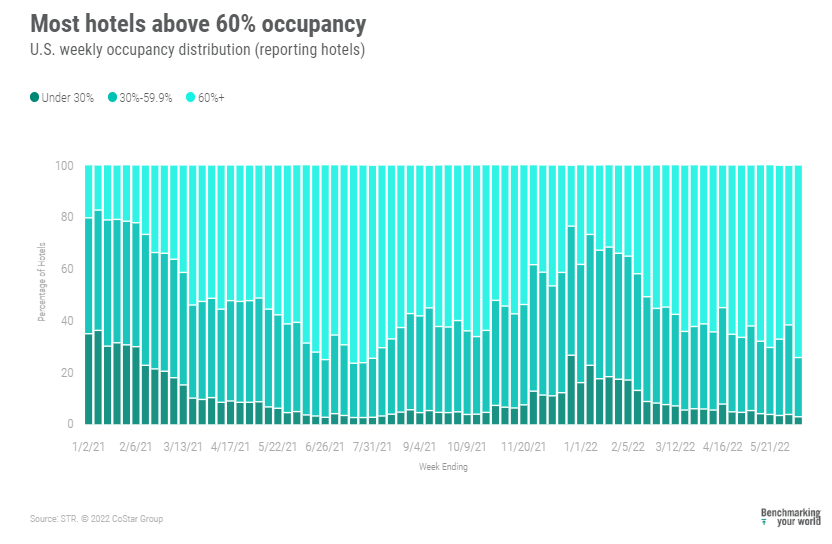
Weekly room demand also reached a pandemic-era high as more rooms were sold (27.6 million) than in any week since early August 2019. Twenty of the 166 STR-defined markets reported their highest weekly demand since March 2020, including Boston, Chicago, Los Angeles, San Francisco, and Seattle. In total, 10 of the Top 25 Markets saw weekly demand reach a pandemic high with four others, including New York City, observing their second highest demand of the era. Alaska had the nation’s highest occupancy this week (86.5%) with Austin coming in second (85.9%). Overall, 73 markets reported occupancy above 70%, the most since summer 2021, with 10 at or above 80%. In the same week of 2021, only 56 markets were above 70%.
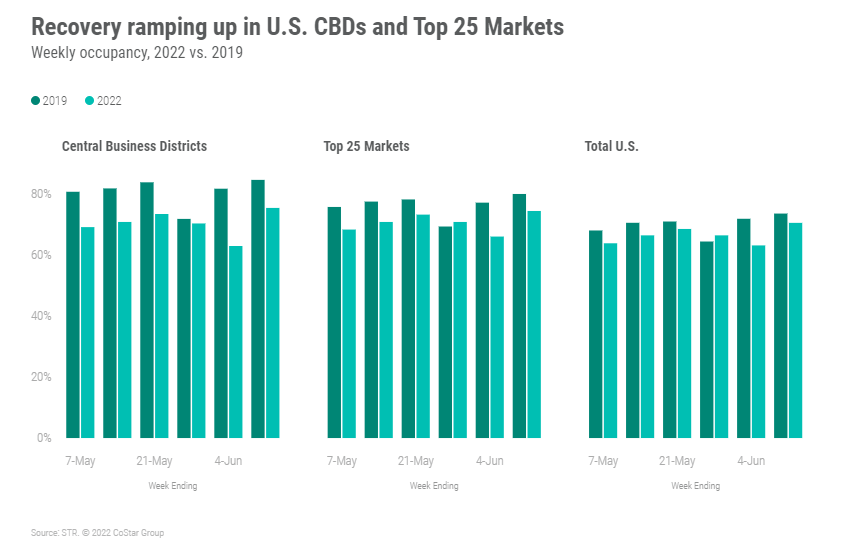
All key performance measures (demand, occupancy, nominal ADR and nominal RevPAR) in the Top 25 markets were at pandemic-era highs with occupancy reaching 74.5% and weekday occupancy edging a bit higher (74.7%). San Francisco posted the highest weekday occupancy of the Top 25 at 90.2% followed by Boston (87.7%). For the full week, Seattle led the Top 25 Markets in occupancy (85.2%) with New York City closely behind (85.1%). On a hotel-level basis and within the Top 25 Markets, 43% posted occupancy above 80%, the most since the start of the pandemic. The solid performance extended into large hotels (300 rooms or more) where 45% reported occupancy above 80%.
Occupancy in central business districts (CBDs) also reached a pandemic record (75.5%) as did nominal ADR (US$250) and RevPAR (US$189). Nine of the 20 CBDs tracked posted their highest weekly and weekday occupancy of the era. Sixty-three percent of CBD hotels saw occupancy above 70% this week with 41% above 80%. A year ago, only 6% were above 80%.
Occupancy in upper upscale (74%) and upscale (75.9%) hotels surged to their highest levels since early March 2020. Nearly half of all upper upscale, large hotels in the Top 25 Markets saw full week and weekday occupancy reach beyond 80%. Occupancy was also strong in luxury (71.6%) and upper midscale (73.8%) hotels. The remaining chain scales saw occupancy at or above 65%.
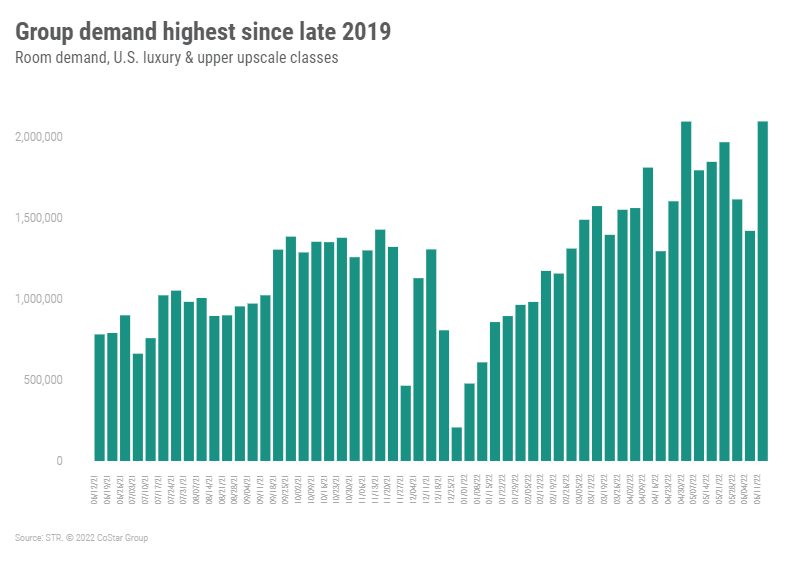
A portion of the strength seen in the Top 25 Markets and among upper upscale hotels came from group demand, which also reached a pandemic record as more than 2.1 million rooms were sold. Group demand was the highest since late 2019 and above what was sold in the comparable week of 2019. Half of the weekly group demand occurred in the first three days of the week, beginning on Monday, suggesting a business focus.
Weekly ADR continued to surge, reaching the second highest nominal level ever recorded by STR. On a chain scale basis, ADR was at a record high in upscale, upper midscale and midscale with upper upscale seeing its second best of the pandemic era. Adjusting for inflation, real ADR was the third highest since 2000. This likely means that the growth also has a demand component versus being primarily inflation-based. Taking a deeper look at how industry ADR is being driven, we found 40% of hotels had a weekly ADR that was 20% or more above 2019 comparables, which is well above the YTD inflation rate of 13%. Another 19% of hotels grew ADR between 13% and 20%. There are, however, 15% of hotels with a weekly ADR below what it was in 2019.
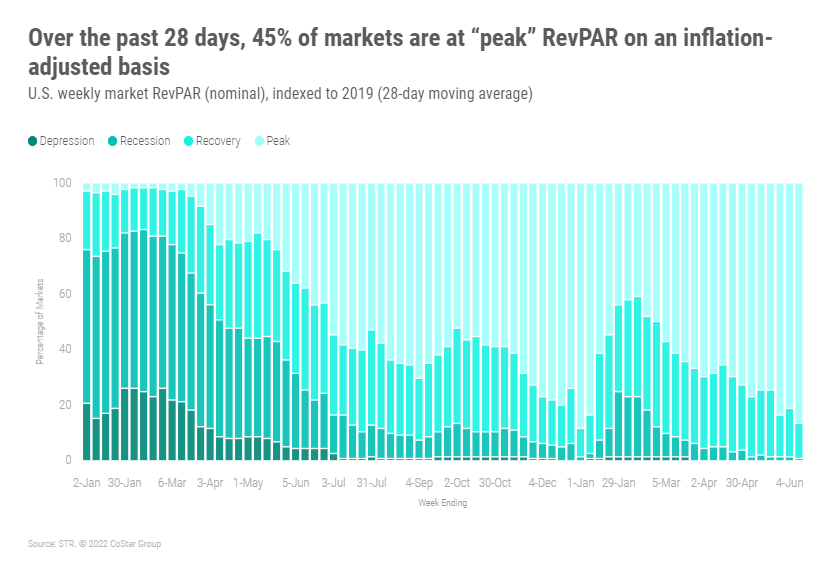
While nominal RevPAR was the highest ever recorded, real RevPAR was well below the weekly record seen in 2016. Nominal RevPAR reached a new pandemic high among the upper upscale, upscale, and upper midscale chain scales. Not surprising, the majority (81%) of markets had weekly nominal RevPAR at a “peak” level (RevPAR indexed to 2019 above 100). Using real RevPAR, 45% were at “peak.” Over the past 28 days, 45% of markets were also at “peak” on an inflation-adjusted basis. Eight markets remained in “depression” (RevPAR indexed to 2019 between 50 and 80), including San Francisco and Washington DC. These markets, however, are seeing solid recovery trends.
Around The Globe
Similar to the U.S., occupancy in the remainder of world reached a pandemic-era high, rising to 64.9%, up 4 percentage points week on week. This weekly level was also the highest since late 2019. The strong growth was led by leisure destinations, including Greece and Fiji. Ireland continued to boast the world’s highest weekly occupancy (85%) followed by Greece (84.3%), and Fiji (81.1%). Fourteen countries reported their highest occupancy of the era, including Canada (70.5%) and Greece.
Among the 10 largest countries based on supply, Italy (77.7%) led followed by the U.K. (77%), and Spain (76.5%). China (50.6%) had the lowest occupancy of the top 10 countries, but it has been trending up, increasing 4.2 percentage points from the prior week. All top 10 countries saw growth in the week except for Germany, where occupancy fell 5.6 percentage points week on week.
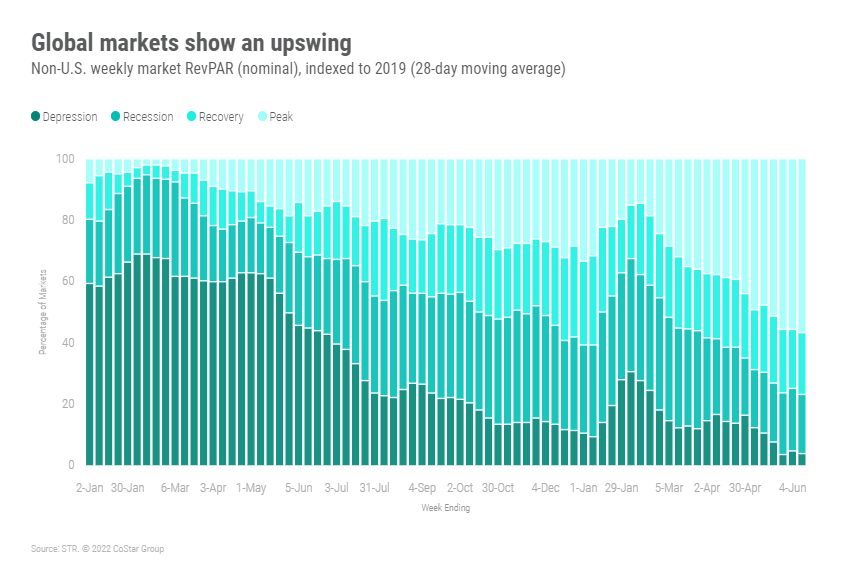
Barcelona (90.8%), Warsaw (89.3%), Dublin (89.1%), Athens (86.9%) and Rome (85%) led global markets in occupancy. It was also good to see Toronto (83.9%) and Vancouver (82.9%) among markets with strong weekly occupancy. Toronto was lifted by the RBC Canadian Open golf tournament. Overall, 57% of non-U.S. markets were at “peak” RevPAR, its highest percentage yet.
Big Picture
Much of the focus has been on the impact of rising inflation and its impact on summer hotel demand. As of now, there seems to be limited impact given that demand is rising at a faster pace than anticipated. This supports our hypothesis that those who travel are less deterred by rising prices. Despite the recent downward trend in the stock market and rising interest rates, households are on solid footing. We agree that there will be some impact from the changing economic conditions, but we still believe that it will be marginal with demand achieving a new industry high this year.