

Having spent several years underwriting hotels using traditional industry data sources, Jeremy Gilston shares an in-depth six-step guide to making your projections more accurate by underwriting channel distribution using the Benchmark & Trendline Report from Kalibri Labs.
Step 1. Underwrite the Market Dynamics
Step 2. Examine the Annual Market Trends
Step 3. Analyze the Subject’s Relative Performance
Step 4. Identify Peak Channel Mix opportunities
Step 5. Optimize the Channel Mix
Step 6. Project the Cash Flows
The analysis below contains the full detail on each step.
STEP I: Understand the Market Dynamics
The subject of this analysis is an upscale branded hotel in a prime beach market. The comp set contains 8 similarly-positioned branded hotels located in the surrounding area, all of which are 2 to 5 miles from the shoreline. Barriers to entry in this market are high and there is no known new supply anticipated to compete directly with the hotels in this analysis.
During prime beach season, the subject and comp set hotels are the lower-priced alternatives to the beachfront hotels and resorts. Given this context, the first step is to view monthly Guest Paid RevPAR trends, which reveals what guests are willing to pay in the market by month.
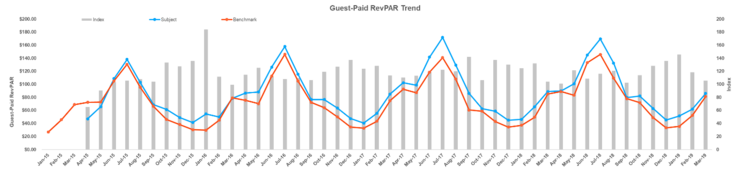
There are clear performance peaks during the prime summer months (June, July, and August) each year for both the subject and comp set. Additionally, the subject hotel (blue) garners higher RevPAR throughout the year.
STEP II: Examine the Annual Market Trends
The annual performance trend data provides insights into market stability and indicates future performance.
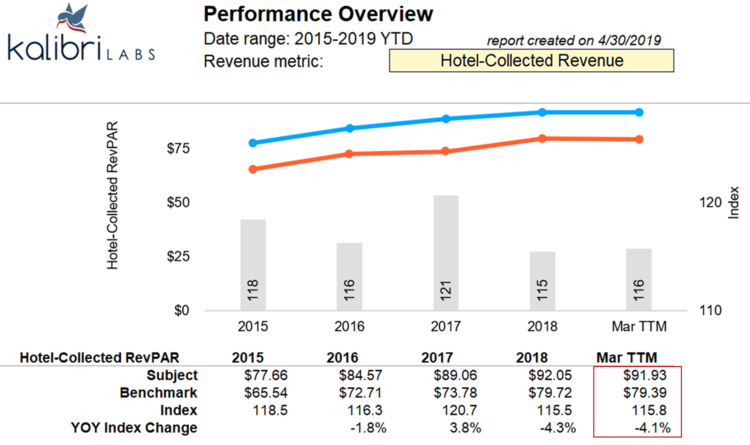
Both the subject and comp set have exhibited performance growth since 2015, peaking in 2018. March 2019 TTM appears to perform slightly below FY 2018, suggesting market stabilization. As such, without knowledge of new economic development anticipated to spur additional hotel demand, there is little evidence to support future top-line revenue growth projections for the area.
STEP III: Analyze the Subject’s Relative Performance
In reviewing the traditional metric of Hotel Collected RevPAR, the subject hotel has stabilized at around a 116 index, making projections for a higher index difficult to support. However, insights into COPE RevPAR expose ways to position this asset for future profit growth.
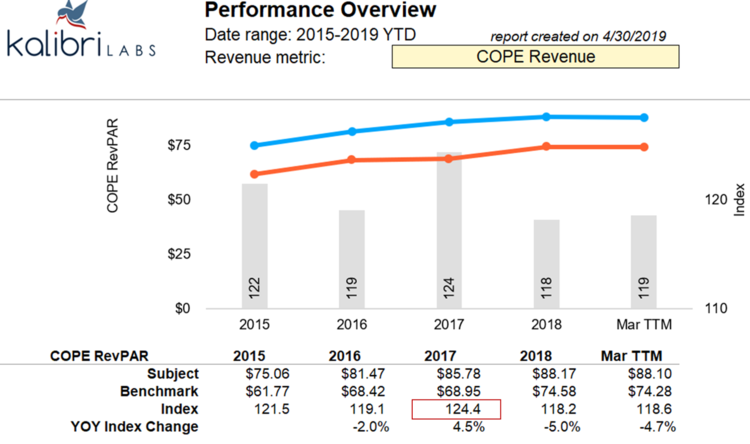
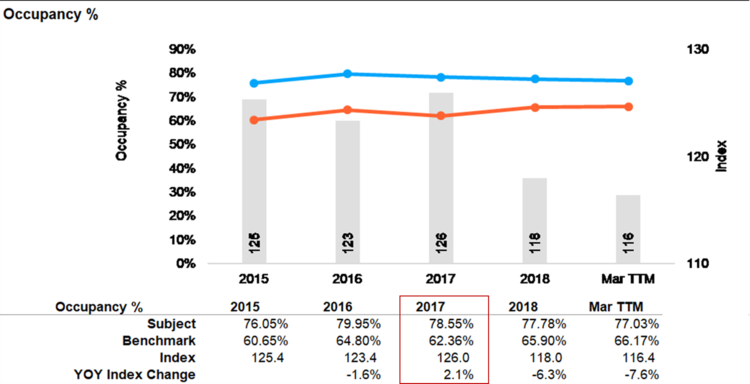
This step shows the historical COPE RevPAR Index peaked in 2017, which was driven by occupancy.
STEP IV: Identify the Peak Channel Mix Opportunities
Although the subject’s peak Guest Paid performance year was 2018, it achieved peak COPE index performance in 2017, which is the true measure of profitability. After analyzing market seasonality and the subject’s peak year of COPE RevPAR performance, the next step is to better understand the channel mix.
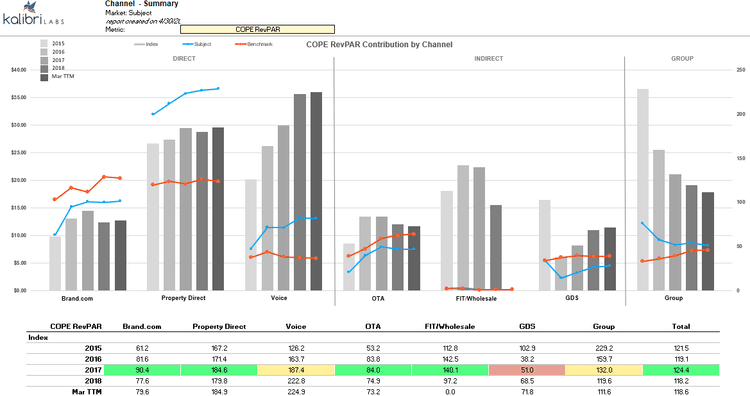
Through a higher relative COPE index via Brand.com, Property Direct, OTA, and FIT/Wholesale performance, the subject was able to out-perform its competitors.
STEP V: Optimize the Channel Mix
Because the subject hotel’s peak COPE RevPAR performance was driven by occupancy, the hotel can optimize its channel mix by strategically offsetting demand in favor of higher-rated business. This step involves identifying each channel’s COPE ADR during the peak occupancy months to better understand the optimal channel mix for increased profitability. This is just one of the many ways to identify COPE ADR-based channel mix opportunities:
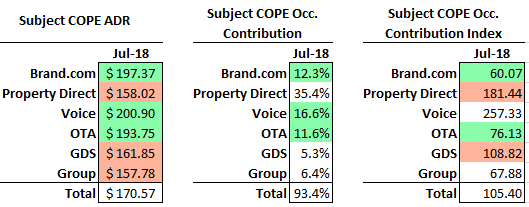
During the peak occupancy month, July, the subject achieved the highest 2018 COPE ADR via the Brand.com, Voice, and OTA channels. While the subject garnered high Voice occupancy indexes (>200 all summer), there might be room to increase profit through Brand.com and OTA.
Because the subject hotel achieved 94% Occupancy in July 2018, capturing additional demand is not reasonable. As such, the hotel must offset other business to achieve higher profit. In this situation, the optimal mix would be to offset Property Direct, GDS, and Group business with additional Brand.com and OTA room nights. This analysis is reasonable so long as the subject’s brand, location, level-of-finish, and positioning can support the change in mix.
STEP VI: Project the Cash Flows
Each firm adheres to its own practices regarding projections, which can be based on factors such as planned capital improvements, loan-to-value ratio (LTV), debt-to-income ratio (DTI), and expected internal rate of returns (IRR). This next and last step is the culmination when the underwriter will apply the insights and analysis from steps I through V to project the asset’s future potential. The following is a rudimentary example of this type of analysis based off the July opportunity analyzed in step V.
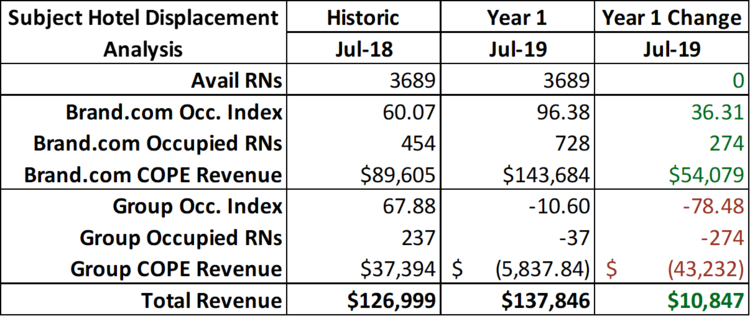
Assuming the 2018 demand and COPE ADR remains in Year 1, simply shifting the July Brand.com Occupancy Index back to the index the subject achieved in 2017, its banner year of performance, adds approximately $11,000 in additional profit. Given that the hotel does not have meeting space or catering, it is important to note that displacing group rooms would not impact ancillary revenues.
Utilizing a standard 8% Capitalization Rate on the additional profit projected for July of Year 1, this analysis yields approximately $135K in additional asset value, which equates to over $1,000 per key. Note that the above analysis is just one example of the many opportunities that can be unearthed with the granular information included in the Benchmark & Trendline Report. The party underwriting the asset will decide which opportunities are feasible and how risk-tolerant or risk-averse to be in the projections.


