For the four-week period ending 14 May 2022, more than three-quarters of all U.S. hotel markets outperformed their comparable 2019 revenue per available room (RevPAR) on a nominal basis.
NB: This is an article from STR
Of 165 STR-defined U.S. markets, only 38 fell short of their 2019 RevPAR, which was a solid improvement from 52 underperformers in April’s “bubble” blog update. Hotel RevPAR looks to be on steady footing; however, a look at RevPAR contribution shows a greater influence from average daily rate (ADR) as opposed to occupancy in many areas.
Subscribe to our weekly newsletter and stay up to date
As a result, we decided to focus in on hotel occupancy for performance leader callouts in this month’s update.
As has been detailed in other STR resources, including our weekly Market Recover Monitor (MRM), ADR gains have been spurred both by higher leisure demand along with inflationary pressures. As a result, only eight markets averaged lower nominal (non-inflation adjusted) ADR from 2019 levels in recent weeks.
Occupancy, on the other hand, accounts for the bulk of the current recovery’s performance deficits. Outside of leisure-oriented destinations, occupancy levels have mostly fallen short of 2019 levels with the steepest deficits in larger, traditionally business-oriented markets. To add further context, only 59 STR-defined markets (representing 31% of total U.S. rooms) met or surpassed their date-matched occupancy levels for the most recent four weeks.
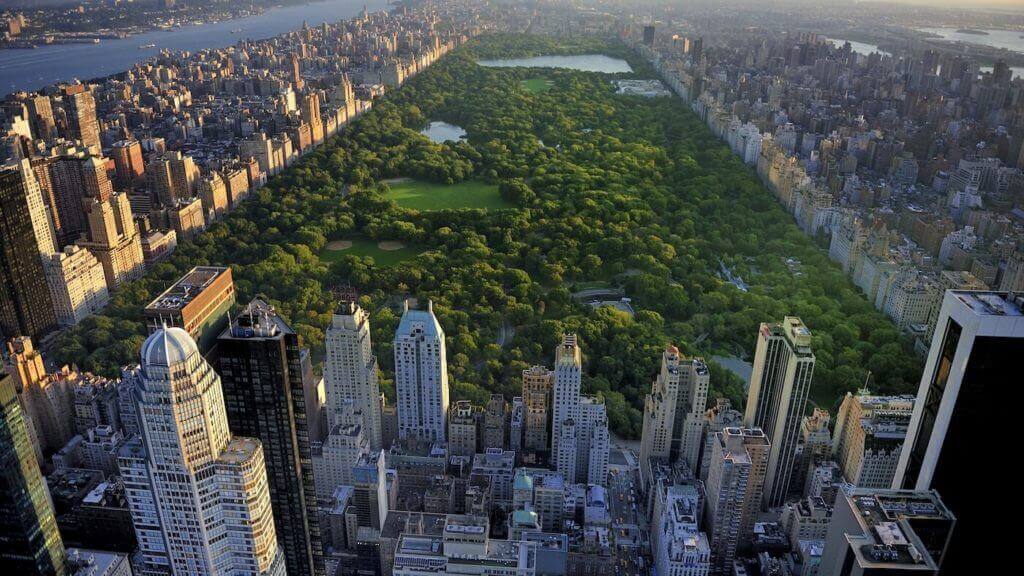
However, we are encouraged to see solid occupancy gains in a number of markets which have been previously passed over by the recovery. The Top 25 Markets continue building on their early Spring performance gains. The banner headline goes to New York City, which led all large markets (and was the third best market overall) with an occupancy of 78.1%, up 1.8 points from the previous month. While that recent occupancy was still 11.0 percentage points below the matched 2019 period, it reveals an enormous rebound from NYC’s February average occupancy of 53.6%. San Diego (76.8%), Oahu (76.2%), Nashville (75.7%) and Miami (75.6%) round out the occupancy leaders.
When diving into the leaderboard for STR’s 651 U.S. submarkets, Key West (86.0%) continues to demonstrate its recovery in occupancy, a strong indication that higher-end leisure travel remains a strong draw in selected markets. Surprisingly, the second through fifth positions for the period go to locations that are not strictly resort/snowbird/beachfront hotspots. For the first time since the recession, this recent four weeks saw a city-centered central business district place second nationally – Nashville’s CBD (83.9% occupancy) was 9.7% points higher than 2019 despite a same-period supply increase of 38%. That is followed by Village/Soho/Tribeca, NY (83.9%), Miami Airport/Civic Center (83.6%) and Santa Monica/Marina del Ray, CA (83.2%). The most notable characteristic among recent occupancy leaders is a combined broader appeal to both business and leisure travelers.


