

Market share benchmarking is without a doubt one of the most important metrics used today by Revenue Managers, Hotel Managers and Owners.
NB: This is an article by Till Benthien, Senior Revenue Manager and Head of Employee Development at berner+becker revenue management
It gives an exact overview of your own sales strategy and sets the revenue per available room in comparison to a well-defined competitor set. Benchmarking allows you to calculate your own market share based on the occupancy, average room rate and revenue per available room (RevPAR).
WHAT KEY FIGURES DOES BENCHMARKING INCLUDE?
The Hotel industry mainly compares the following three factors: occupancy, average room rate (net) and RevPAR. These are used for evaluation in relationship between the own hotel and the competitor hotels. The three KPIs resulting from the calculations are: Market Penetration Index (MPI), Average Rate Index (ARI) and Revenue Generating Index (RGI). Hereby the RGI is the most important measurement, since the RGI reflects both occupancy and average rate.
The three KPIs are calculated as follows:
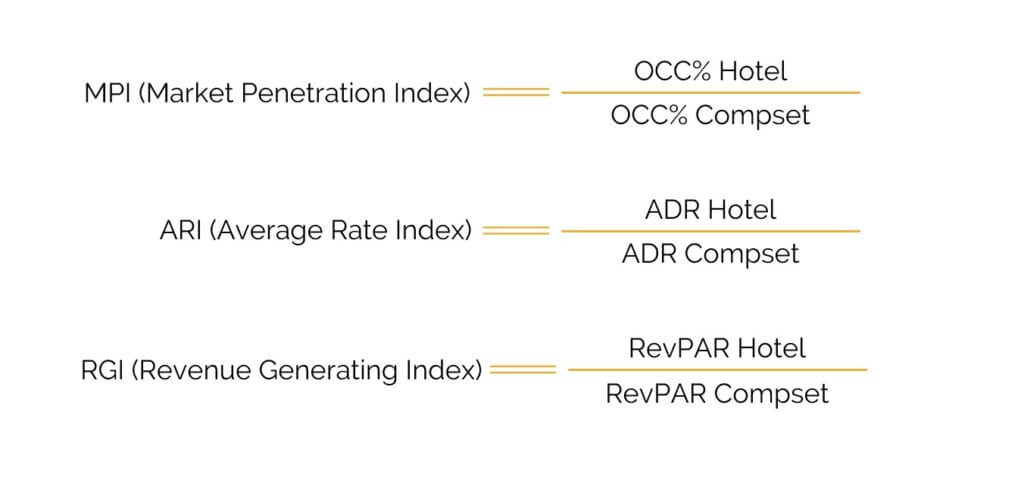
A value of 100 shows that your hotel receives a fair share of the market. An RGI below 100 means the competitors are more successful and have bigger share of the market. A value above 100 means the opposite: the hotel is more successful than the competitor average and receives a higher share of the market.
However, in some cases the ideal RGI KPI is not 100 (https://www.bernerbecker.com/latest-articles/100-rgi-market-share-target-often-pointless/). In many cases there is no ideal, comparable compset.
WHY DO I NEED BENCHMARKING?
Daily Benchmarking against a set of competitors is a unique opportunity to measure the effectiveness and accuracy of your own business strategy. It allows for an analysis of the impacts of your pricing and segmentation strategy on your RevPAR in comparison to the defined competitor hotels. Benchmarking is showcasing if your RevPAR is growing faster or slower than the compset average. In addition, it allows for a detailed analysis trough which lever the RevPAR has been increased, as it compares your occupancy and ADR development to the compset, too. Through this you can clearly measure the impact of any new pricing strategy or segment shift. Maybe the increase in prices have led to a higher increase in ADR versus the competitive set, but you lost more occupancy than them? Maybe the same can be seen among your competitors and/or the market? With the help of daily Benchmarking data, you can easily find an answer to these questions.
On days with high occupancies, you maybe increased your ADR much more than your compset without losing volume at the same time. This would mean a clear boost to your RevPAR growth outperforming the market around you.
Review of your strategy
The comparison with competitors is a unique opportunity to check your own strategy success. This makes it possible to clearly calculate the impact of the pricing and/or segmentation strategy of one’s own RevPAR compared to its competitors. Benchmarking shows whether your own RevPAR is growing stronger or weaker compared to its competitors. It also allows a detailed analysis through which leverage the RevPAR has been increased since the occupancy and ADR are also shown. In this way the effect of a new pricing strategy or a desired segment shift can be clearly measured. Perhaps raising the prices has led to a higher ADR and a higher ADR at the expense of a lower occupancy? Did something similar happened to the competitors and/or the market? These questions are clearly answered by benchmarking.
On a previous day of high demand, the strategy adjustment may have been more successful, and you increased the ADR without volume losses giving your RevPAR a significant growth boost above the average market growth.
Insight into the market development
In the budget season, the goals for the coming year are set. But how can a hotelier determine whether his own goals are realistic compared to the real market development? Between the preparation of the budget and the end of the current year, many market factors can change. Economic crisis’s, changes in the fair calendar and fluctuating demand in the corporate and conference business have a major impact on your own business. On the other hand, these factors may have a very positive effect, too, and support the hotel in exceeding the set budget goals.
An internal comparison of KPIs to other periods and years is not enough to assess whether the hotel is performing great or not. It is important to compare your KPIs to a defined set of competitors through proactively examining the daily benchmarking numbers. This is the only way for hoteliers to recognize what phase the market is in and can accurately estimate their own growth and adjust the strategy if necessary.
Dividing the year into demand periods
Access to competitors daily RevPAR figures and market data allows for an easy classification of the year into different demand periods, and with that you can create tailor made strategies for any of them. Hoteliers can compare their own demand periods with those of the market and spot in which periods there is still more revenue potential available and in which periods they are already more successful than the compset average.
Insight into the strategy of the competitors
Access to daily benchmarking figures allows to draw conclusions on the strategy of the competitors. The following questions can be answered: on which days are my competitors more or less occupied than my property and what is their average rate? Do the competitors aim for the highest possible occupancy or do they try to optimize the average rate on certain days or periods? The insight into the compset’s strategy is an indispensable tool especially for the highest revenue days, e.g. fairs and events. The daily benchmarking report shows the competitor KPIs and their growth rates for each of these days, allowing you to analyse their strategy, evaluate it and optimize your own strategy accordingly to stay ahead of the competition.
Discover and actively exploit potential for the future
The use of daily benchmarking data has become an indispensable tool in modern revenue management. It is only on this basis that the full potential of a hotel’s performance can be derived per day of the week and the strategy adapted accordingly. An analysis based solely on internal data cannot deliver the same achievements. We therefore recommend all hoteliers who are actively involved in the topic of revenue optimization to use a market share report broken down into daily data. It is the only way to set the RevPARs of each day in relation to their competitors and to recognize the impact of their own strategic decisions and the success of the hotel.
Read more articles on berner+becker’s newsroom page and follow berner+becker on LinkedIn


