Spring trends in hotel search
With trivago’s 1.4 billion annual searches, we see many clear trends in user search behavior and preferences. From that data*, we ascertained some best practices for hoteliers to follow when marketing their properties and setting their price strategy. What follows are a few factoids and infographics as they relate to spring trends 2017.
What are guests willing to pay per night?
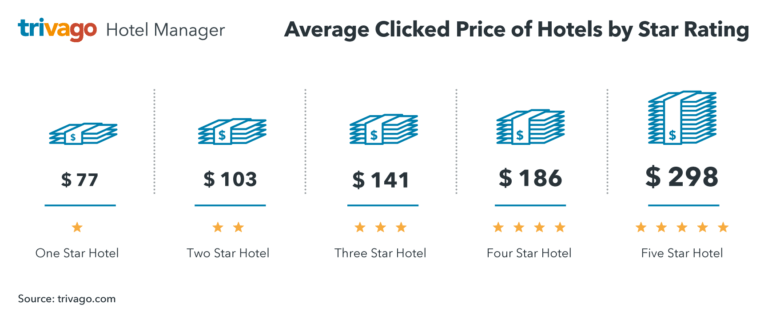
Guests preferences are as varied and diverse as are their choice of hotels to choose from. Within these preferences, there are some clear indicators on how much money guests are willing to pay, depending on the nature of the accommodation.
What kind of accommodation are you? Does your pricing strategy reflect the figures below? If your rates are lower than this, then perhaps you are missing out on revenues. However, if your rates are significantly higher than the average for your star rating and you have lots of empty rooms, then a price adjustment to something more in-line with the below findings might be something you want to consider.

How does location impact price per night?
The average room rate per night in New York City is nearly equal to that of the national average 5-star hotel nightly rate. Of course, not everyone visiting New york City is staying at a 5-star accommodation, so what does this figure reveal?
What this chart tells us is that New York City and Miami Beach hotels are pricier destinations per room night than the national average and therefore guests are going to fall more solidly into either the category of willing to splurge, or being very price-sensitive once they arrive. You should be ready with upselling opportunities, but also be able to offer local deals and opportunities for bargains at the concierge.
On the other side, destinations such as Las Vegas and Myrtle Beach are well below the national 3-star average price, which suggests they are looking for the best deals in these areas and will be more open to greater spending on their whole trip experience.


