
Hotel industry fundamentals are good, and will continue to improve. But the hotel industry is being punished by the disconnect between the investment community of Wall Street and actual performance of the hotels on Main Street. More on the nature of this disconnect shortly, but first, here is the current situation as summarized by Vail Brown of STR last week at the 26th annual Los Angeles hotel investment conference, Meet the Money®.

Total United States Key Performance Indicator Outlook (% Change vs. Prior Year) 2016 – 2017
Note that the actual results for 2015 and the forecast for 2016 and 2017 are pretty good – not as spectacular as they have been in some recent past years, but very sound in terms of long-term trends. Notice also that the average national supply growth is still below the 2% level that raises concerns for oversupply. Demand growth is continuing at a rate greater than supply growth, and that is healthy. While occupancy growth is modest, strong ADR growth is driving RevPAR growth at good levels.
Looking beyond the averages into specific markets
National average statistics are most informative when variations from the median are relatively small. Also, averages can be misleading when there are statistical outliers or even significant variations. That seems to be the case currently, with markets like New York City and Houston struggling, and significant localized damage in oil patch markets.
This problem is illustrated by this slide from Vail Brown’s presentation at Meet the Money®. Note that the declining RevPAR growth in New York City and Houston dragged down the entire industry averages. Many industry leaders believe that New York’s problems have also overly influenced the financial community’s perspective on the hospitality industry, incorrectly assuming that industry performance in New York City is representative of the entire industry.
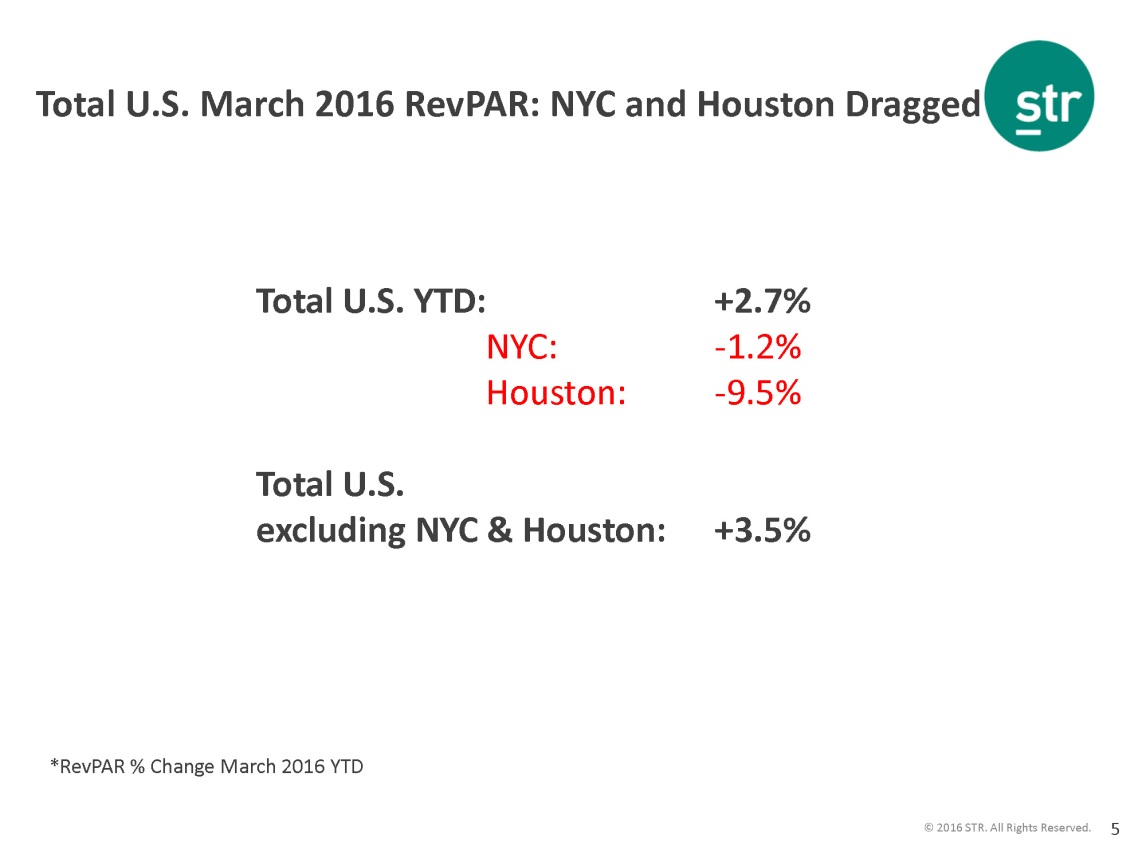
Here is what this slide tells us. Total US RevPAR growth in March, 2016 was +2.7%. But NYC had negative RevPAR growth of -1.2% and Houston had -9.5%. If you take these two cities out of the calculations, then total national RevPAR growth in march was +3.5%, instead of 2.7%.
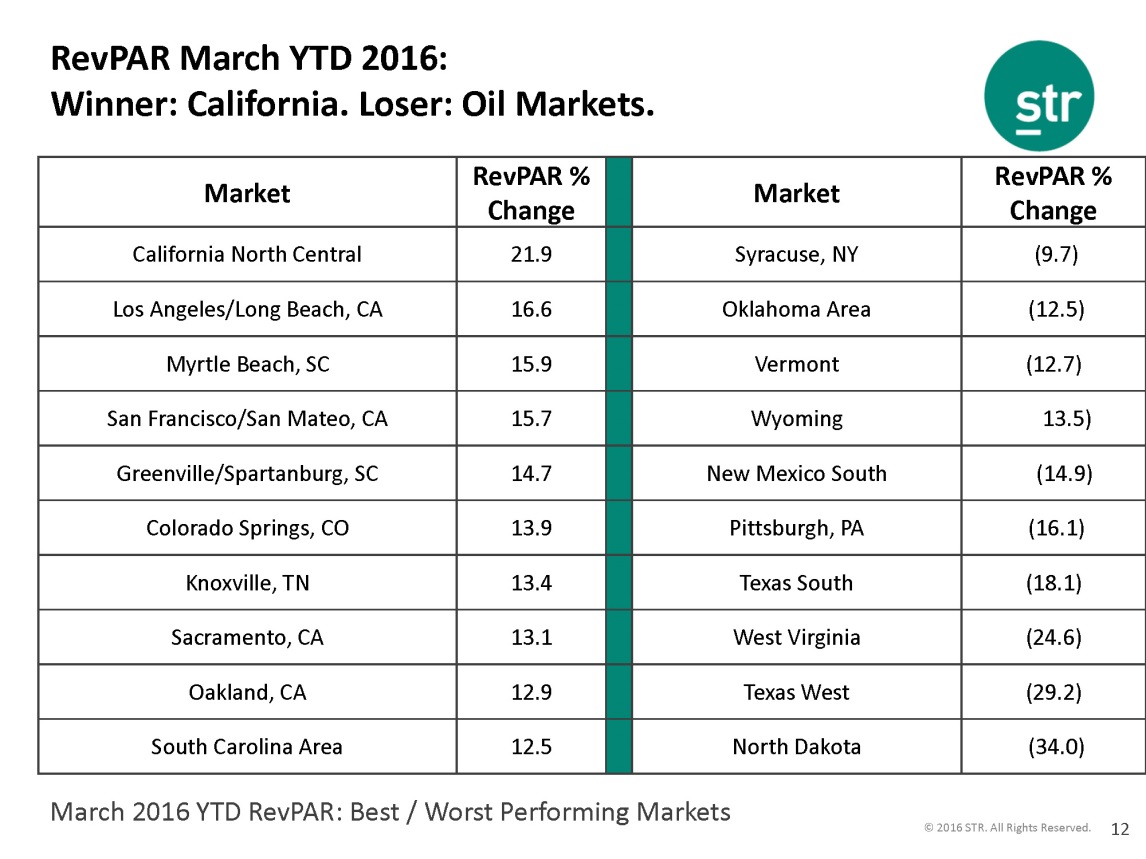
But the variation by market can be very large, with year-to-date RevPAR growth in top markets ranging from 12.5% to an eye-popping 21.9% for California North Central.
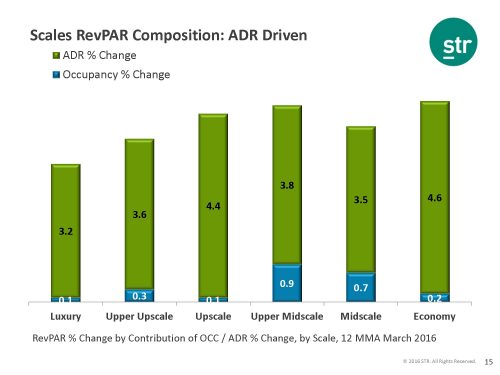
ADR growth is driving RevPAR growth
Revenue per available room or RevPAR has 2 factors for its calculation – occupancy and rate or ADR. Although RevPAR growth continues at a healthy rate, in the early stages of the recovery, it was driven almost completely by occupancy with little or no contribution coming from rate. Now RevPAR growth is being driven by ADR increases with relatively little contribution from occupancy growth. The following slide from STR illustrates this.
RevPAR growth is slowing – are we nearing the end of the cycle?
RevPAR growth has now been sustained for 73 months, and some worry that the current recovery is getting “long of tooth.” Furthermore, the rate of RevPAR growth has declined significantly, and this decline in the growth rate (although RevPAR is still increasing) has caused Wall Street analysts to look on the industry with disfavor because it has lost the spectacular growth rate it enjoyed when the recovery began from the greatest downturn in history.


