In every crisis it is inevitable to hit rock bottom. We all know this, but it’s easy to forget. In fact, we rush to recover without having reached the bottom, and it’s conceptually impossible. Before starting to climb, you have to stop falling.
NB: This is an article from mirai
How can we know if we have reached that minimum threshold? For several weeks at Mirai we have been analyzing the pickup per week (reports for week 13, 14, 15, 16 and 17) of the most important destinations. Reaching that minimum point would be “good news” within the drama that the sector is experiencing. At least we would stop the bleeding and, inasmuch, could start the recovery.

Historical collapse of the pickup
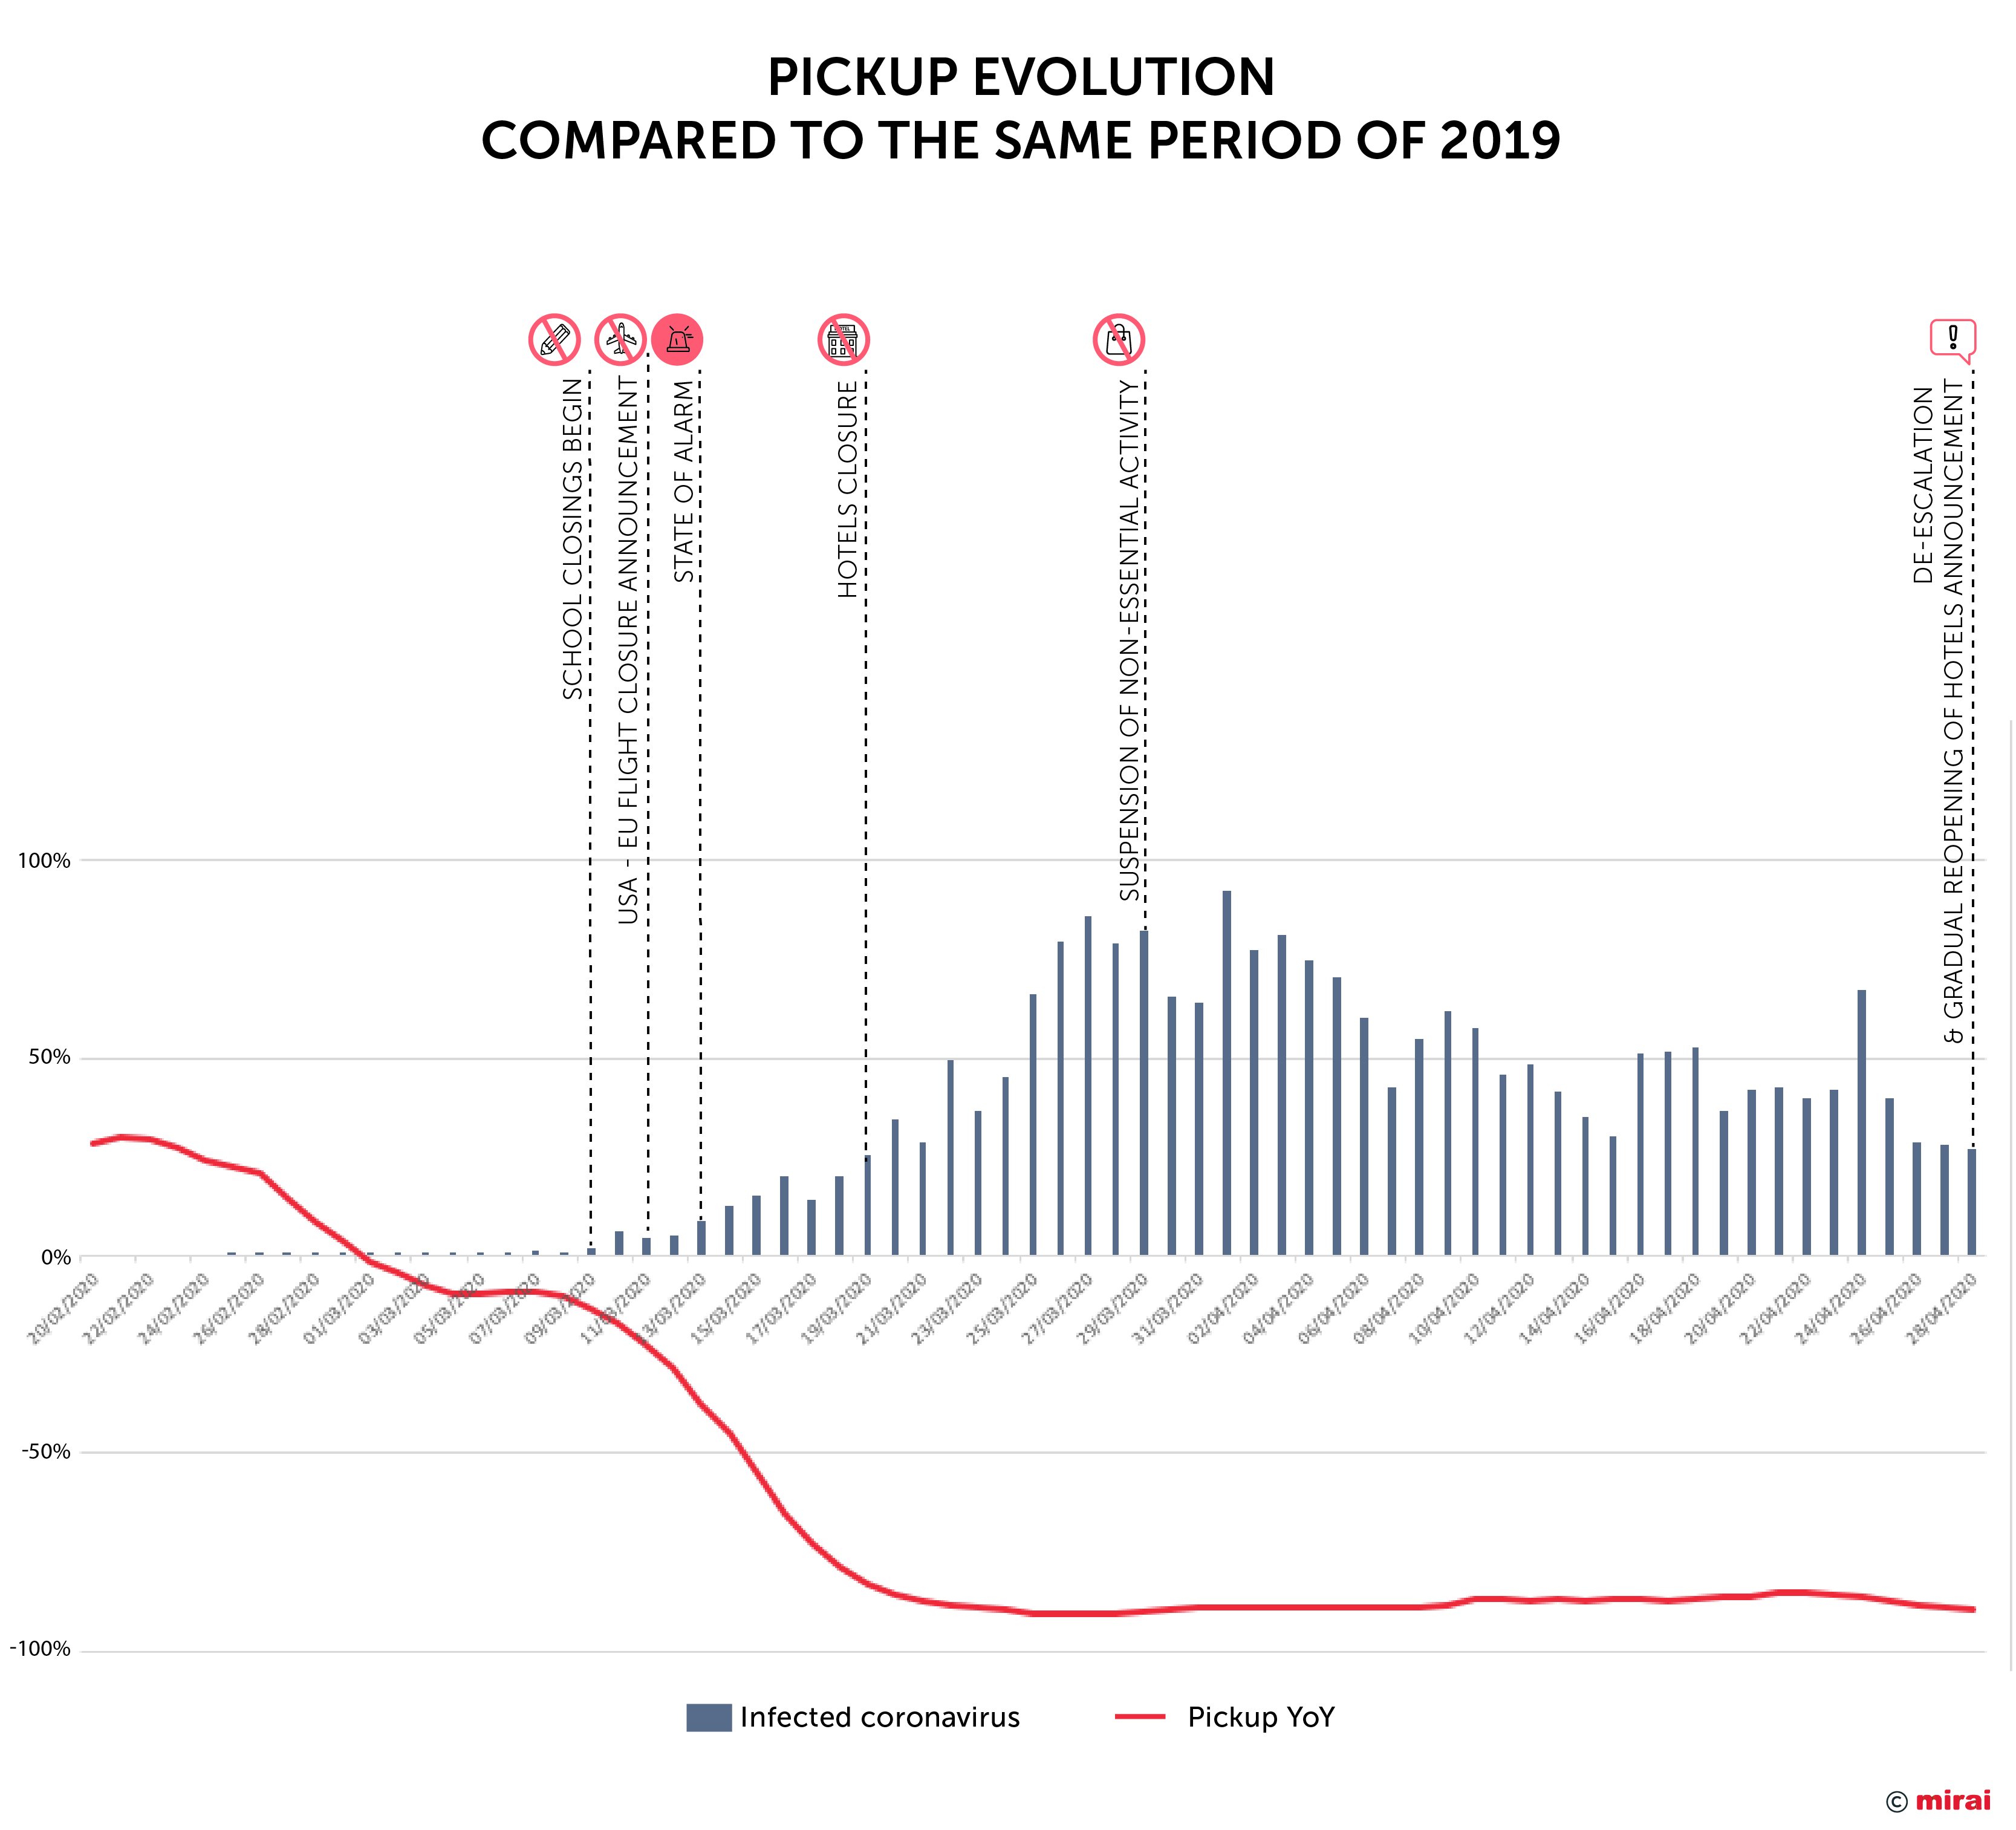
The direct relationship of the pickup (in this post the data is specifically from hotels in Spain, but it is expected that the curve is similar in each destination) with events and the growth of the rate of infection is obvious. The correlation is direct and evident. The absence of flights, the closure of hotels, and the tremendous panic generated, explains why we are in the worst possible scenario.
After the unprecedented collapse of the pickup in recent weeks, it seems we are in a “flat” stage, with very low levels of demand and with very little variation from day to day; as if everything was on standby. The comparisons with the budget and last year have been in the drawer for weeks, and the situation is unprecedented.
Given the uselessness of comparing with the previous year, the only possible option is to look at the previous week and, when it arrives, the previous month. What is traditionally a mistake in the hotel sector (due to the high seasonality of demand) today seems to be the only possible alternative. At least this way we will know if there is a downward, flat or upward trend (even minimally).
We start from scratch
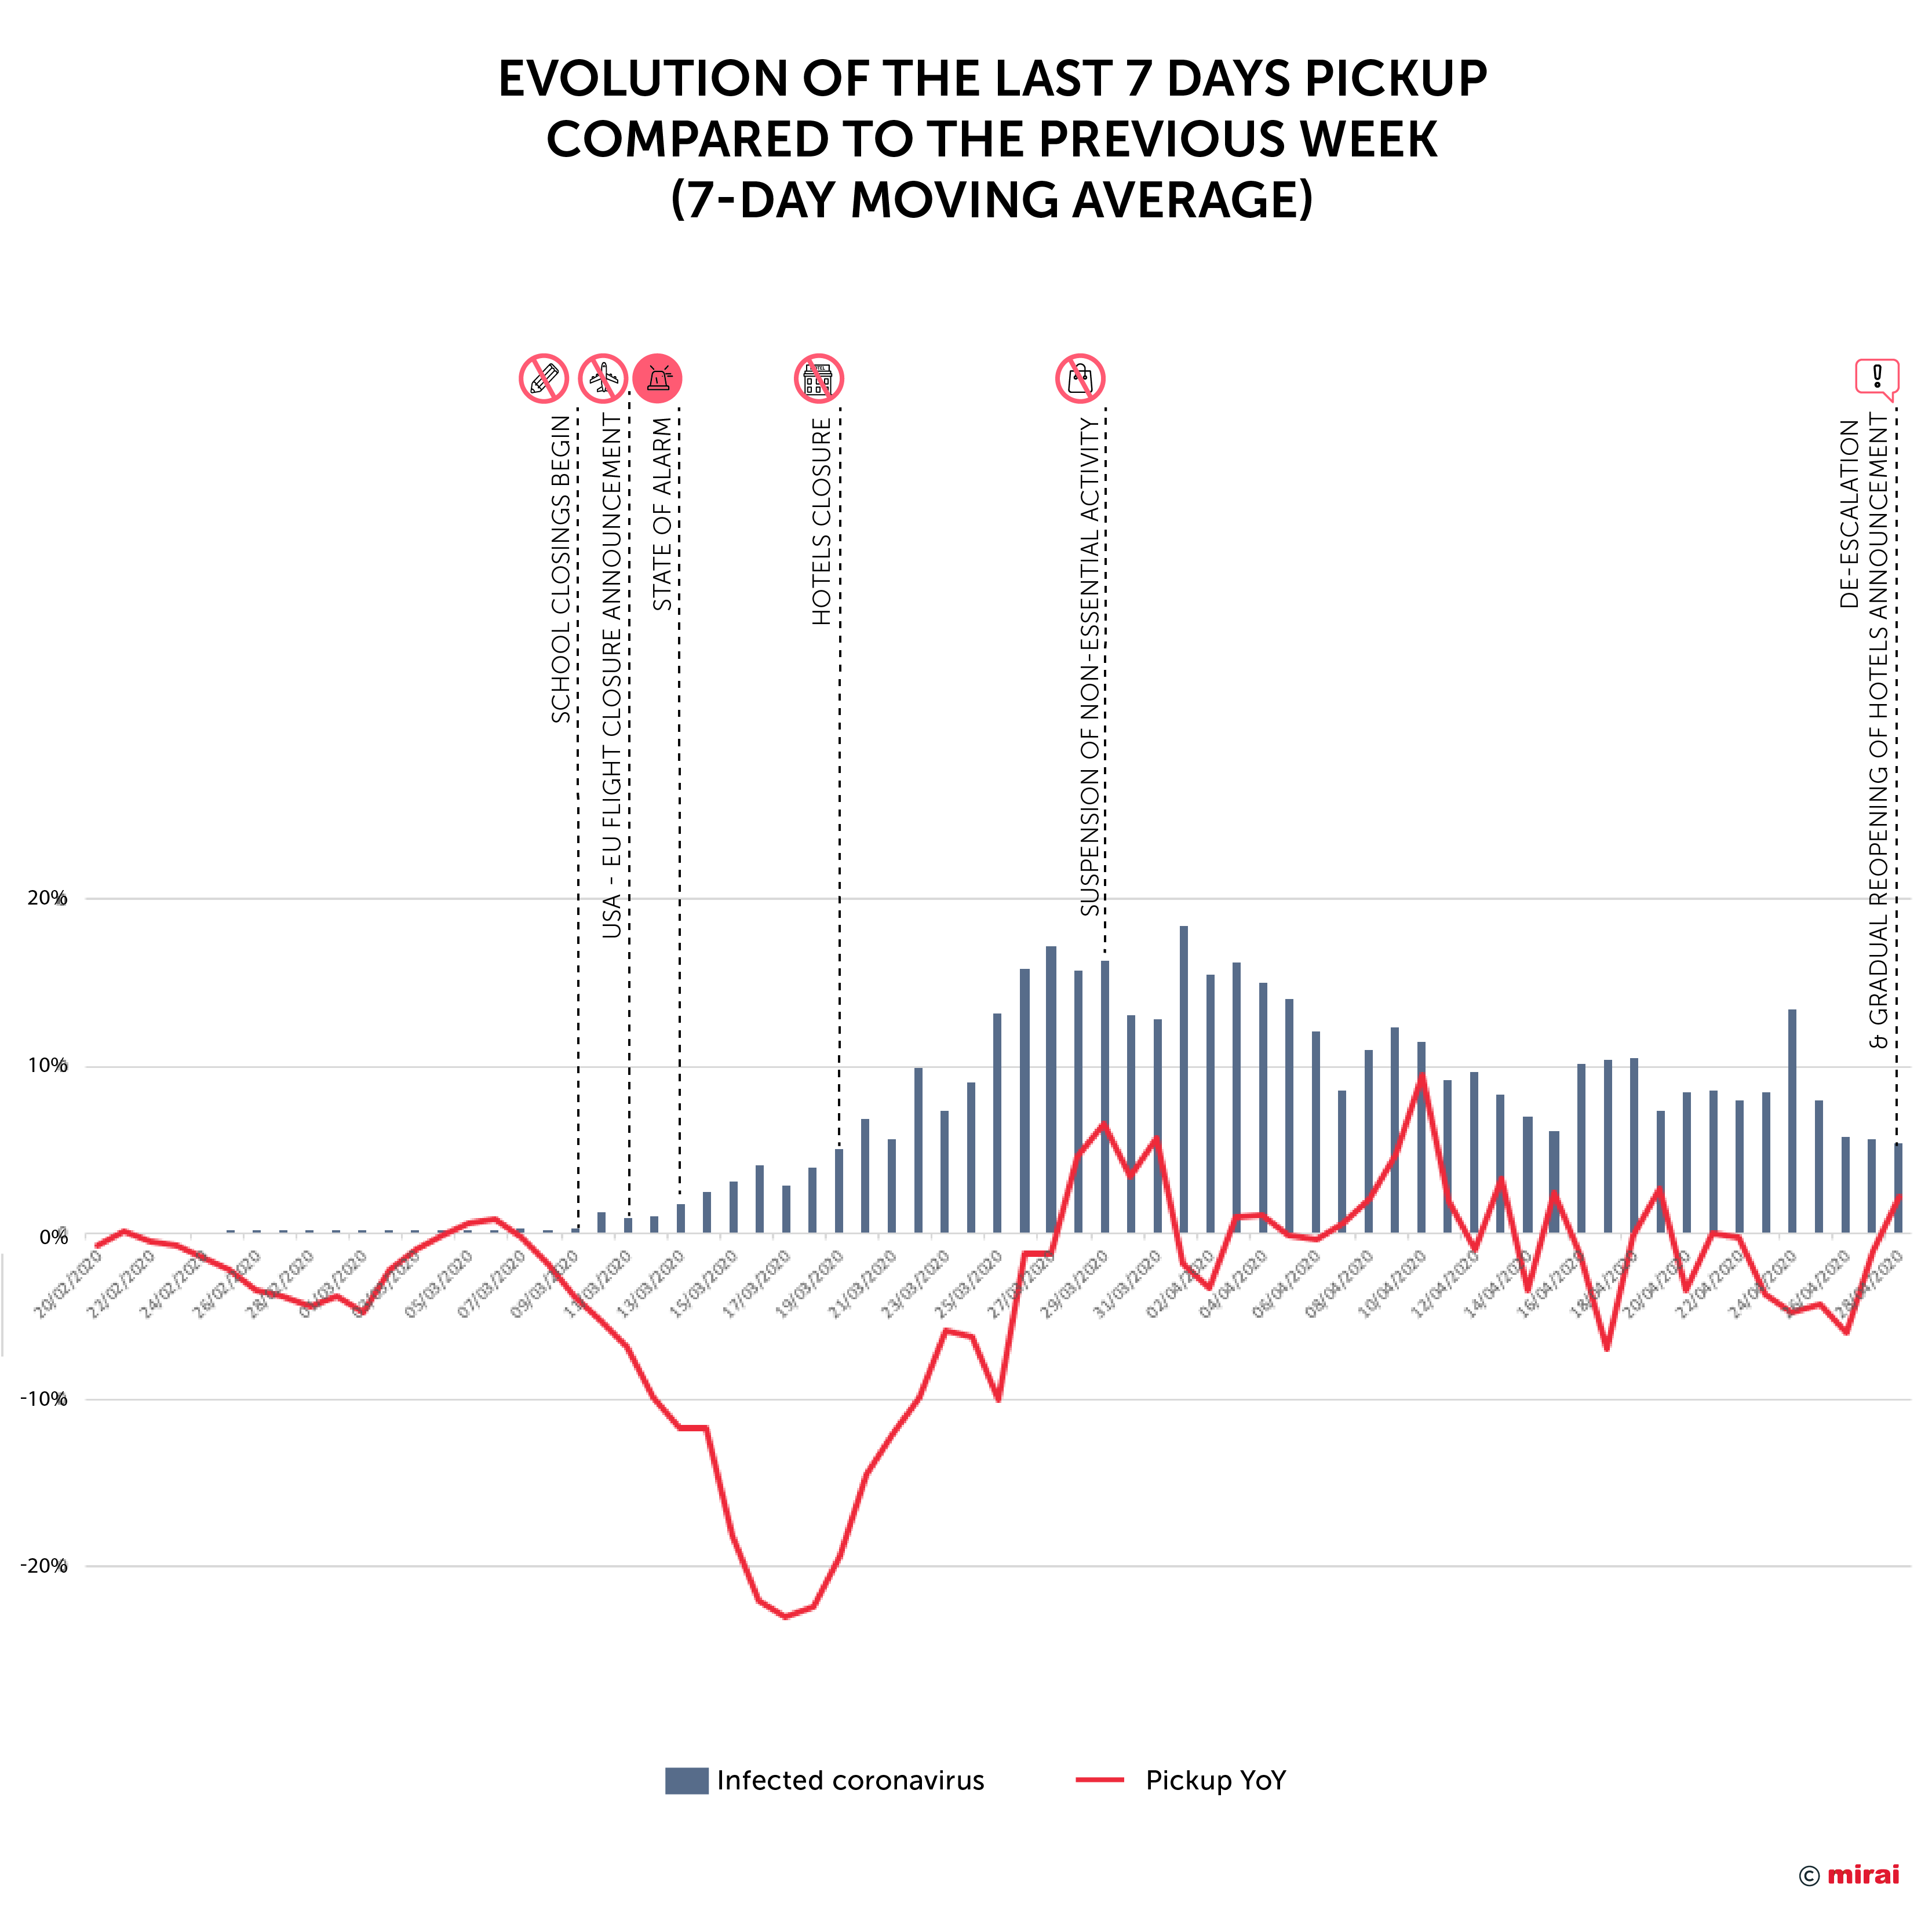
Comparing each day with the previous one does not work. The pickup has its own seasonality depending on the day of the week. To correct this, we add the room nights generated that day and the previous six days, and compare it with the same data from the previous day (a moving average of seven days). This vision gives us a much more accurate picture of the sharp falls we have experienced, that began on March 9 and lasted until March 29, thus adding up to 20 days of cumulative drops (near -90% over the previous year). From the end of March, the curve moderated and we entered into a zig-zag alternating slight growths and new falls. Hard to read what’s going on.
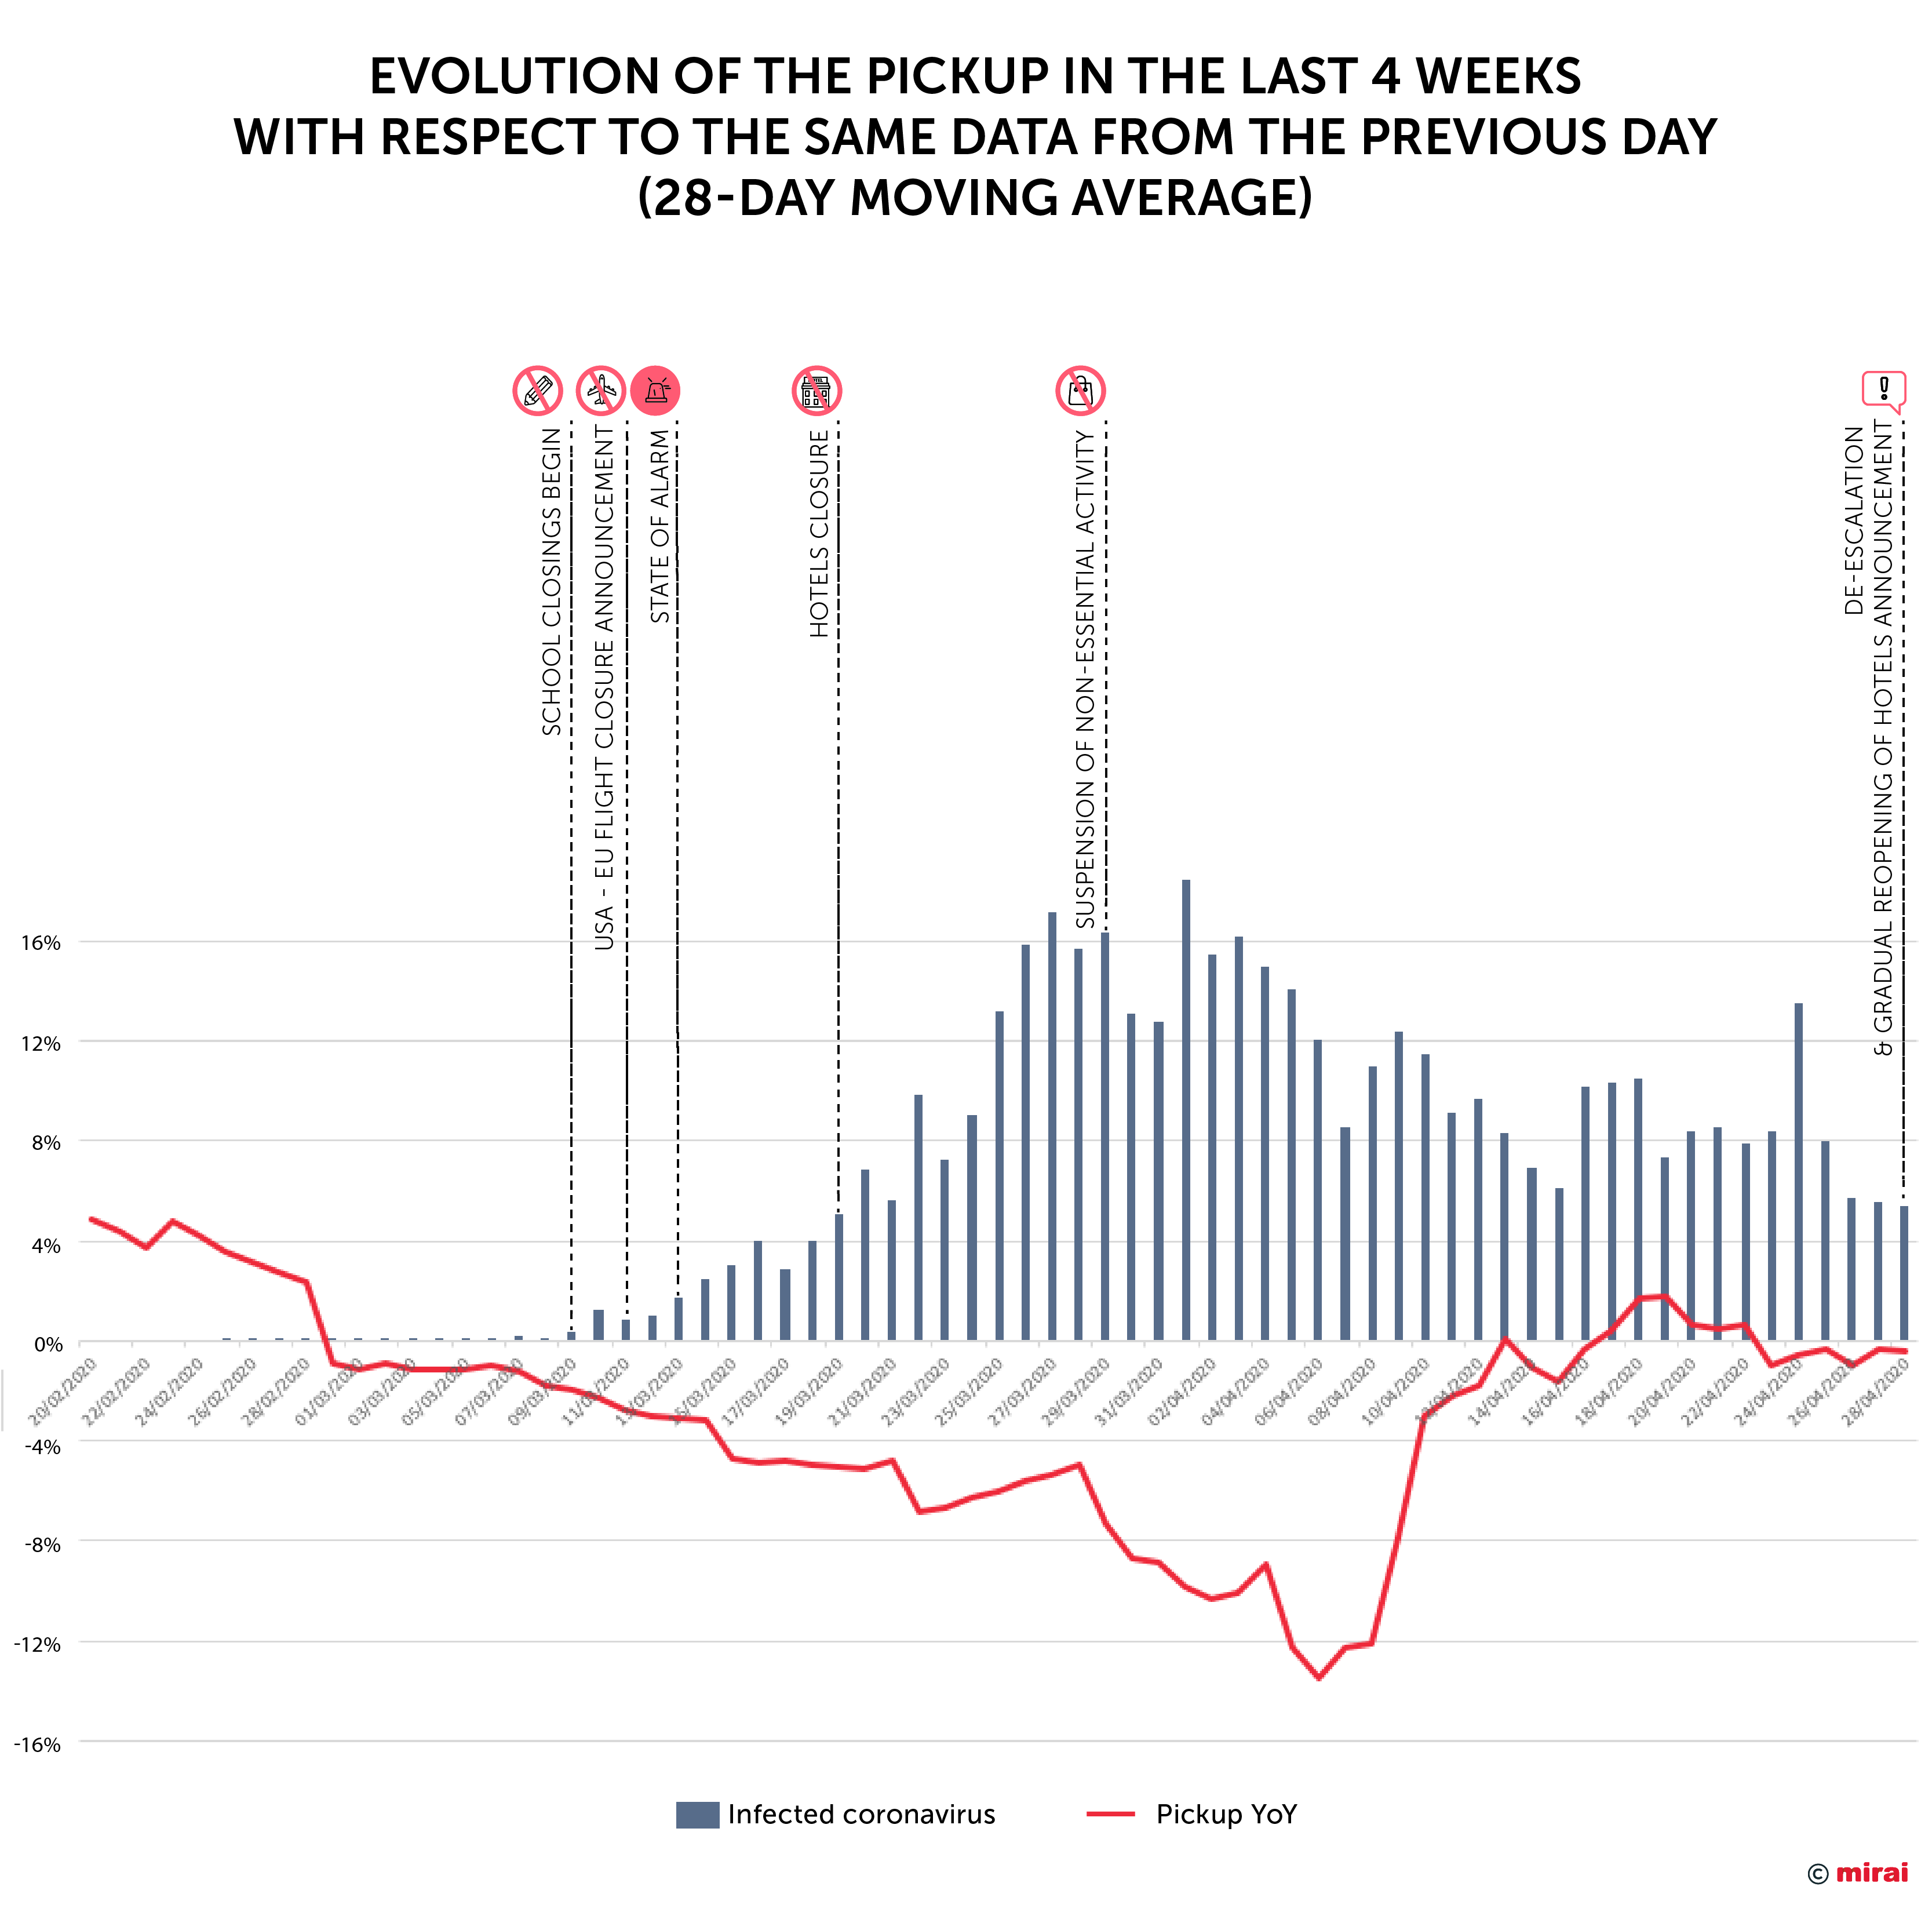
To eliminate these “saw teeth” we will gain some height by calculating the moving average of 28 days (4 weeks) instead of 7 (1 week). This way, we adjust for seasonal holidays such as the recent Easter. We see the picture changing substantially and helping us identify a pattern. This trend seems to indicate that April 6 could be a possible “maximum drop date”, after which the decreases become less and less pronounced, reaching for the first time a very slight growth (less than 1%) on April 17. Remember that we talk about growth over the previous 28 days and never compared to last year. But this April 17 could be our “ground” from which we could only go up.
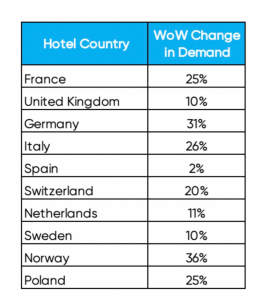
These data coincide with those recently published by Koddi where they showed a growth of 2% of the demand towards Spain as a destination.
But be aware that this trend can change (and go back down), as seen in the following days, although it is a zig-zag around zero rather than a downward or upward trend.
The importance of hitting rock bottom
The moment we hit rock bottom is the first step towards recovery and, therefore, a little “good news”. It is a paradox that indicates the worst possible moment in accumulated numbers (which is a real drama for the sector) but, at the same time, points out a change in trend where the upcoming dates should go better.
But, much to our regret, we must reach this bottom to rise again. And the sooner we do it, the better. It remains to be seen what the recovery curve will look like. The options on the table are a “V” exit, a dreaded “U” exit or an undesirable “W” exit. Time will tell, and we will discuss it when we have data to back it up. Meanwhile, it seems that we are at the lowest point, whatever the future holds. And it all starts with a plan to de-escalate or reopen the hotel industry, as seems to be happening in Spain (although with very strong restrictions) as announced by the Government on Tuesday, April 28.
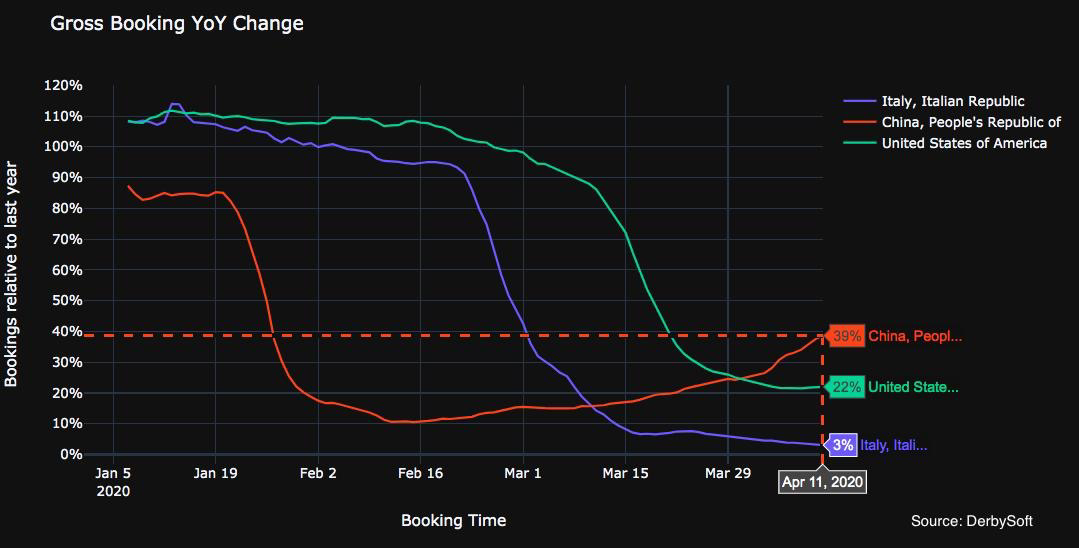
We can only look at the countries for which we have data: China and increasingly Italy. Thanks to a recent report by Derbysoft, we see that the recovery seems to have started (remember that China is more than two months ahead of Spain in this crisis, and Italy a couple of weeks). The pace for now is slow, but at least the trend is positive.
No differences between national and international market
We might have expected that the national market would be the first to hit bottom and the first to recover. Instead, we see that the differences in the pickup curves between the national and international markets were almost identical with only a difference of days. If we analyze by specific countries we see that the British market is the first to be reactivated (for stays especially after summer), having reached its “bottom” on April 10, while the German, French and American did so somewhat later (between April 15 and 19). The national market hit its theoretical bottom on April 17, since which it maintains minimally positive shares already.
Conclusion
Consulting the pickup on a daily basis is certainly discouraging today. Everything is paralized waiting for something to happen. It is more worthwhile to follow the evolution of the health crisis in our country, as well as in each of our markets of origin (and each country their own). All things considered, the pickup will continue the same trend, staggered a few weeks. Let us trust, as the data suggests, that we are at the “bottom” and therefore also at the beginning of recovery.

