

After the first strategic part, we can concentrate on the most tactical part, the operational part of the data analysis that will lead us to the definition of market positioning to conclude again on the benchmarking strategic analysis.
NB: This is an article from Fabrizio La Volpe, Trainer & Consultant at Hotelperformance
With the help of tools such as Rate shoppers, which help us find information on the sale price, we could easily fill in the following table.
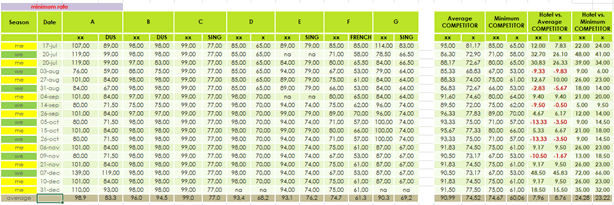
We could concentrate on the analysis of specific days related for example to particular events, or on our positioning on the Mondays of May or – preferable choice but strictly dependent on the final objective – to understand our positioning in the long term by defining 2/3 subdivisions (high / medium / low seasonality; mid-week / weekend; etc.).
We could do it for single occupation or double occupancy,
both for the minimum rate or we may want to determine only the positioning of
the Suites with the Best Available Rate.
In this last case we should make sure that the Competitive Set selected is consistent with our goal.
In some cases and for some segments, such as Business Group or FIT, the data should be found differently (mystery call, convention bureau, etc.).
After the research and data collection, we can position on a graphic system. It is time to move on to analyse data.
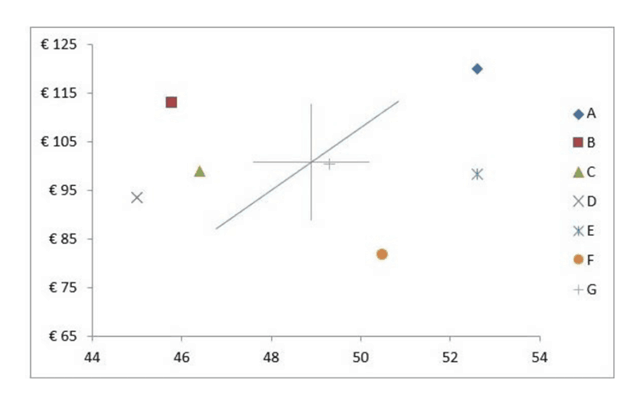
In the example below on the x-axis we have the quality score, on the ordinates the average price of a period, for a particular day or any time interval depending on the objective of the analysis.
There are also the average (between quality and price, indicated with the big cross in the center) and the median (the blue line).
Starting from the left we can see how the Hotel B, with a lower quality and a higher price compared to C, is potentially excluded given the worst quality / price ratio. The same applies to A compared to E.
F has the best quality / price ratio (high quality / low price), but this index is often influenced only by the low price.
Ex: (quality 8 / price € 100) * 100 = ratio 8; (quality 8 / price 80 €) *100 = ratio 10;
F is actually losing many revenue opportunities: given the quality elements, it would probably be chosen compared to D, B, C and G – cut off from the market – even if the price was higher. Similar conclusion between A and E.
G has the best placement, but not because it is closer to the average.
For each competitor, the importance of this graph lies in the distance from the median shifted into the average point. In fact, this indicates, with the right price / quality ratio, the surplus to be paid for each perceived quality point.
Ex: quality 48, the market considers ideally correct to pay a price of about € 95; quality 52, the price becomes € 115.
A is near the straight line; its positioning is correct. B, C and D are above the median, their ratio is too low (high price compared to quality). For E and G, the opposite is true: the quality / price ratio is too high (price too low).
With this new reading, C, for example, could try to increase perceived quality (perhaps in services and comfort, its weaknesses in qualitative analysis) by keeping the price constant.
However, it is difficult to concentrate on a single parameter.
The advice is to carry out both steps: slightly lower prices, which, together with efforts to improve quality, will increase the ratio. We move, in this case, from price € 100 with quality 46 to price € 90 with quality 47.
Once we reach the point on the median, we will have to raise prices and quality accordingly by following the median.
Finally, remember that the loyal customer is not very price sensitive. The loyal customer is the one who would pay more and benefit from the higher value of our services.
In the following graph there are dozens of other analyses to do but it is important to note that, compared to the previous graph, the median is less inclined. In this competitive set, an additional quality point requires less economic outlay cost.
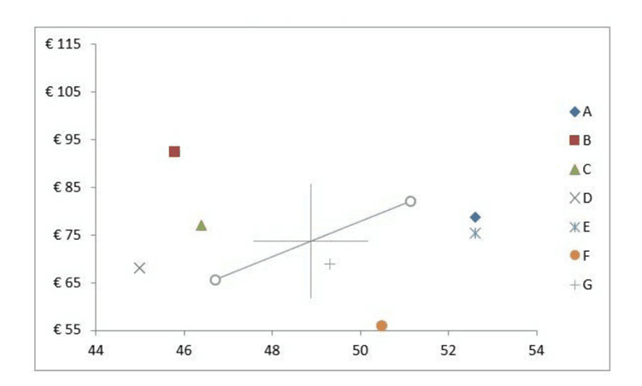
In this case, you could switch from quality 48 with price 70
€ to quality 52 with price 85 €.
The lower price gap makes this demand more flexible than the previous one.
The variation in the elasticity of the offer and the positioning of all competitors on the most profitable segments should be examined on a quarterly / six-monthly basis.
Furthermore, through benchmarking tools, which provide us
with aggregate data on competitors we have determined, we should constantly
monitor benchmarking data, but we’ll talk about this in a next article.
In the long run, by taking decisions that are consistent with the evolution of the market, we will not only optimize our sales product but, by collaborating in a healthy way with our competitors, we will also be able to stop the battle on the price and commoditization of the sector.


