

In a previous benchmarking article, we set the stage for using indexing to measure performance recovery in the pandemic era.
NB: This is an article from STR
STAR Report users will already be familiar with indexes—they are, after all, used to measure market penetration (MPI), revenue generation (RPI) and average rate (ARI) in those reports. Indexing industry-level performance is the same idea, but instead of comparing a property to its comp set at one moment in time, an industry segment is compared to itself at two different moments in time.
Subscribe to our weekly newsletter and stay up to date
Let’s start with a quick example.
TRI: total-room-inventory methodology, which assumes no temporary closures due to the pandemic
RevPAR: revenue per available room
Users can interpret an industry index the same as a STAR Report RGI.
Using STR’s global coverage as an example, and instead of covering RevPAR percent change from 2020, the map below shows RevPAR indexed to 2019.
There are many potential stories in this measurement, but let’s note the key points. As a reminder, STR’s standard methodology, different from the TRI methodology noted above, accounts for only those open hotels.
- Europe is the clear laggard with standard RevPAR only one-quarter of its 2019 level—due in large part to strict lockdowns and many markets’ limited ability to drive domestic demand even under reduced restrictions.
- At three-quarter of the way back to “normal,” Mainland China not only leads recovery, but nearly all temporarily closed hotels have reopened, as evidenced by the one-point difference in TRI and standard RevPAR index.
- Southern Africa and Central America, on the other hand, still have a lot of hotel rooms offline and remain less than halfway to their prior RevPAR highs.
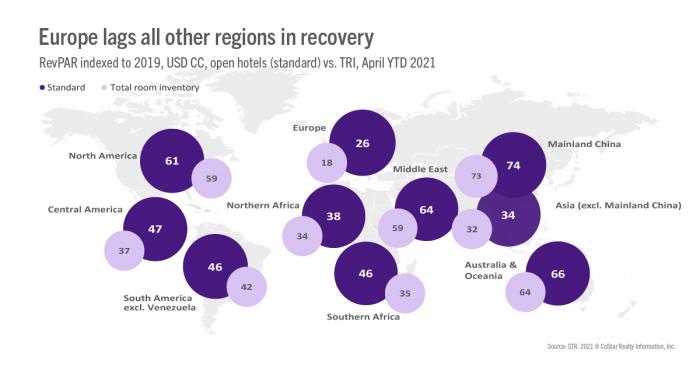
Using an index is mostly a matter of reframing your thinking: South America is at 46% of 2019 levels, or 46% of the way back to “normal”, or just under halfway of the way back to the highest year-to-date RevPAR ever recorded.
Still have questions? Here is another example. In the basic table below, the third column shows that both occupancy and ADR reached 80% of their 2019 levels this past month. However, we note that average daily rate (ADR) reached its highest-ever March level in 2019, creating a much higher mountain to climb. As such, that ADR of US$106 actually compared more with 2012 levels.
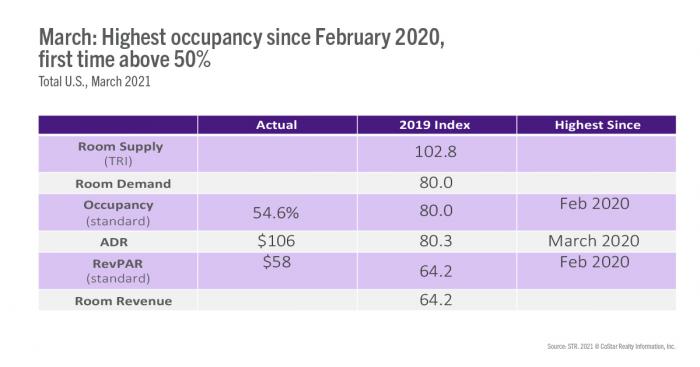
Again, indexing is mostly a matter of reframing your thinking. The industry was at 64% of 2019 levels, or 64% of the way back to “normal”, or nearly 2/3 of the way back to the highest March RevPAR ever recorded.
Conclusion
Indexes are incredibly versatile. Generally, 2019 should be the “base” year on your index and serve as the replacement for any chart using year-over-year percent change. For a longer trend, however, try indexing to the starting year that makes the most sense for you. Indexing will remain essential even as more time passes and year-over-year comparisons begin to normalize.


