

Almost every consultant or in-house SEO will be asked at some point to investigate an organic traffic drop. I’ve investigated quite a few, so I thought I’d share some steps I’ve found helpful when doing so.
Is it just normal noise?
Before you sound the alarm and get lost down a rabbit hole, you should make sure that the drop you’re seeing is actually real. This involves answering two questions:
A) Do you trust the data?
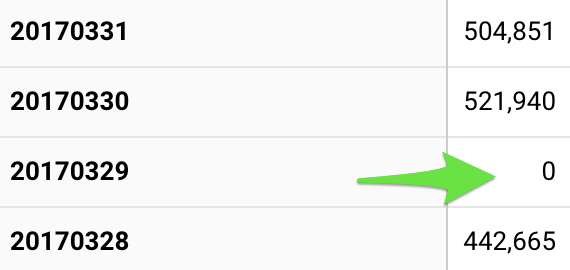
This might seem trivial, but at least a quarter of the traffic drops I’ve seen were simply due to data problems.
The best way to check on this is to sense-check other metrics that might be impacted by data problems. Does anything else look funky? If you have a data engineering team, are they aware of any data issues? Are you flat-out missing data for certain days or page types or devices, etc.? Thankfully, data problems will usually make themselves pretty obvious once you start turning over a few rocks.
B) Is this just normal variance?
Metrics go up and down all the time for no discernible reason. One way to quantify this is to use your historical standard deviation for SEO traffic.
For example, you could plot your weekly SEO traffic for the past 12 months and calculate the standard deviation (using the STDEV function on Google Sheets or Excel makes this very easy) to figure out if a drop in weekly traffic is abnormal. You’d expect about 16% of weeks to be one standard deviation below your weekly average just by sheer luck. You could therefore set a one-standard-deviation threshold before investigating traffic drops, for example (but you should adjust this threshold to whatever is appropriate for your business). You can also look at the standard deviation for your year-over-year or week-over-week SEO traffic if that’s where you’re seeing the drop (i.e. plot your % change in YoY SEO traffic by week for the past 12 months and calculate the standard deviation).


