
It’s easy to be impressed by rising revenues: a full lobby, strong ADR, or a healthy RevPAR line can make any market look like it’s thriving. But when you zoom in on what really matters – profit – the story often changes.
NB: This is an article from HotStats
Subscribe to our weekly newsletter and stay up to date
That’s why leading investors, operators, and asset managers are shifting focus: from top-line performance to true profitability intelligence.
At HotStats, our Market Insights reports go beyond surface metrics like RevPAR and ADR. These uncover how markets actually perform at the profit and cost level – providing a profitability lens that turns data into smarter investment, asset, and operational decisions.
In this article, we’ll explore some of the key metrics that reveal whether top-line growth is translating into real bottom-line results.
The figures below are from a hypothetical Profit Impact Snapshot, modeled after our Market Insights reports, to illustrate how these insights can guide you. Tap the image to take a closer look.
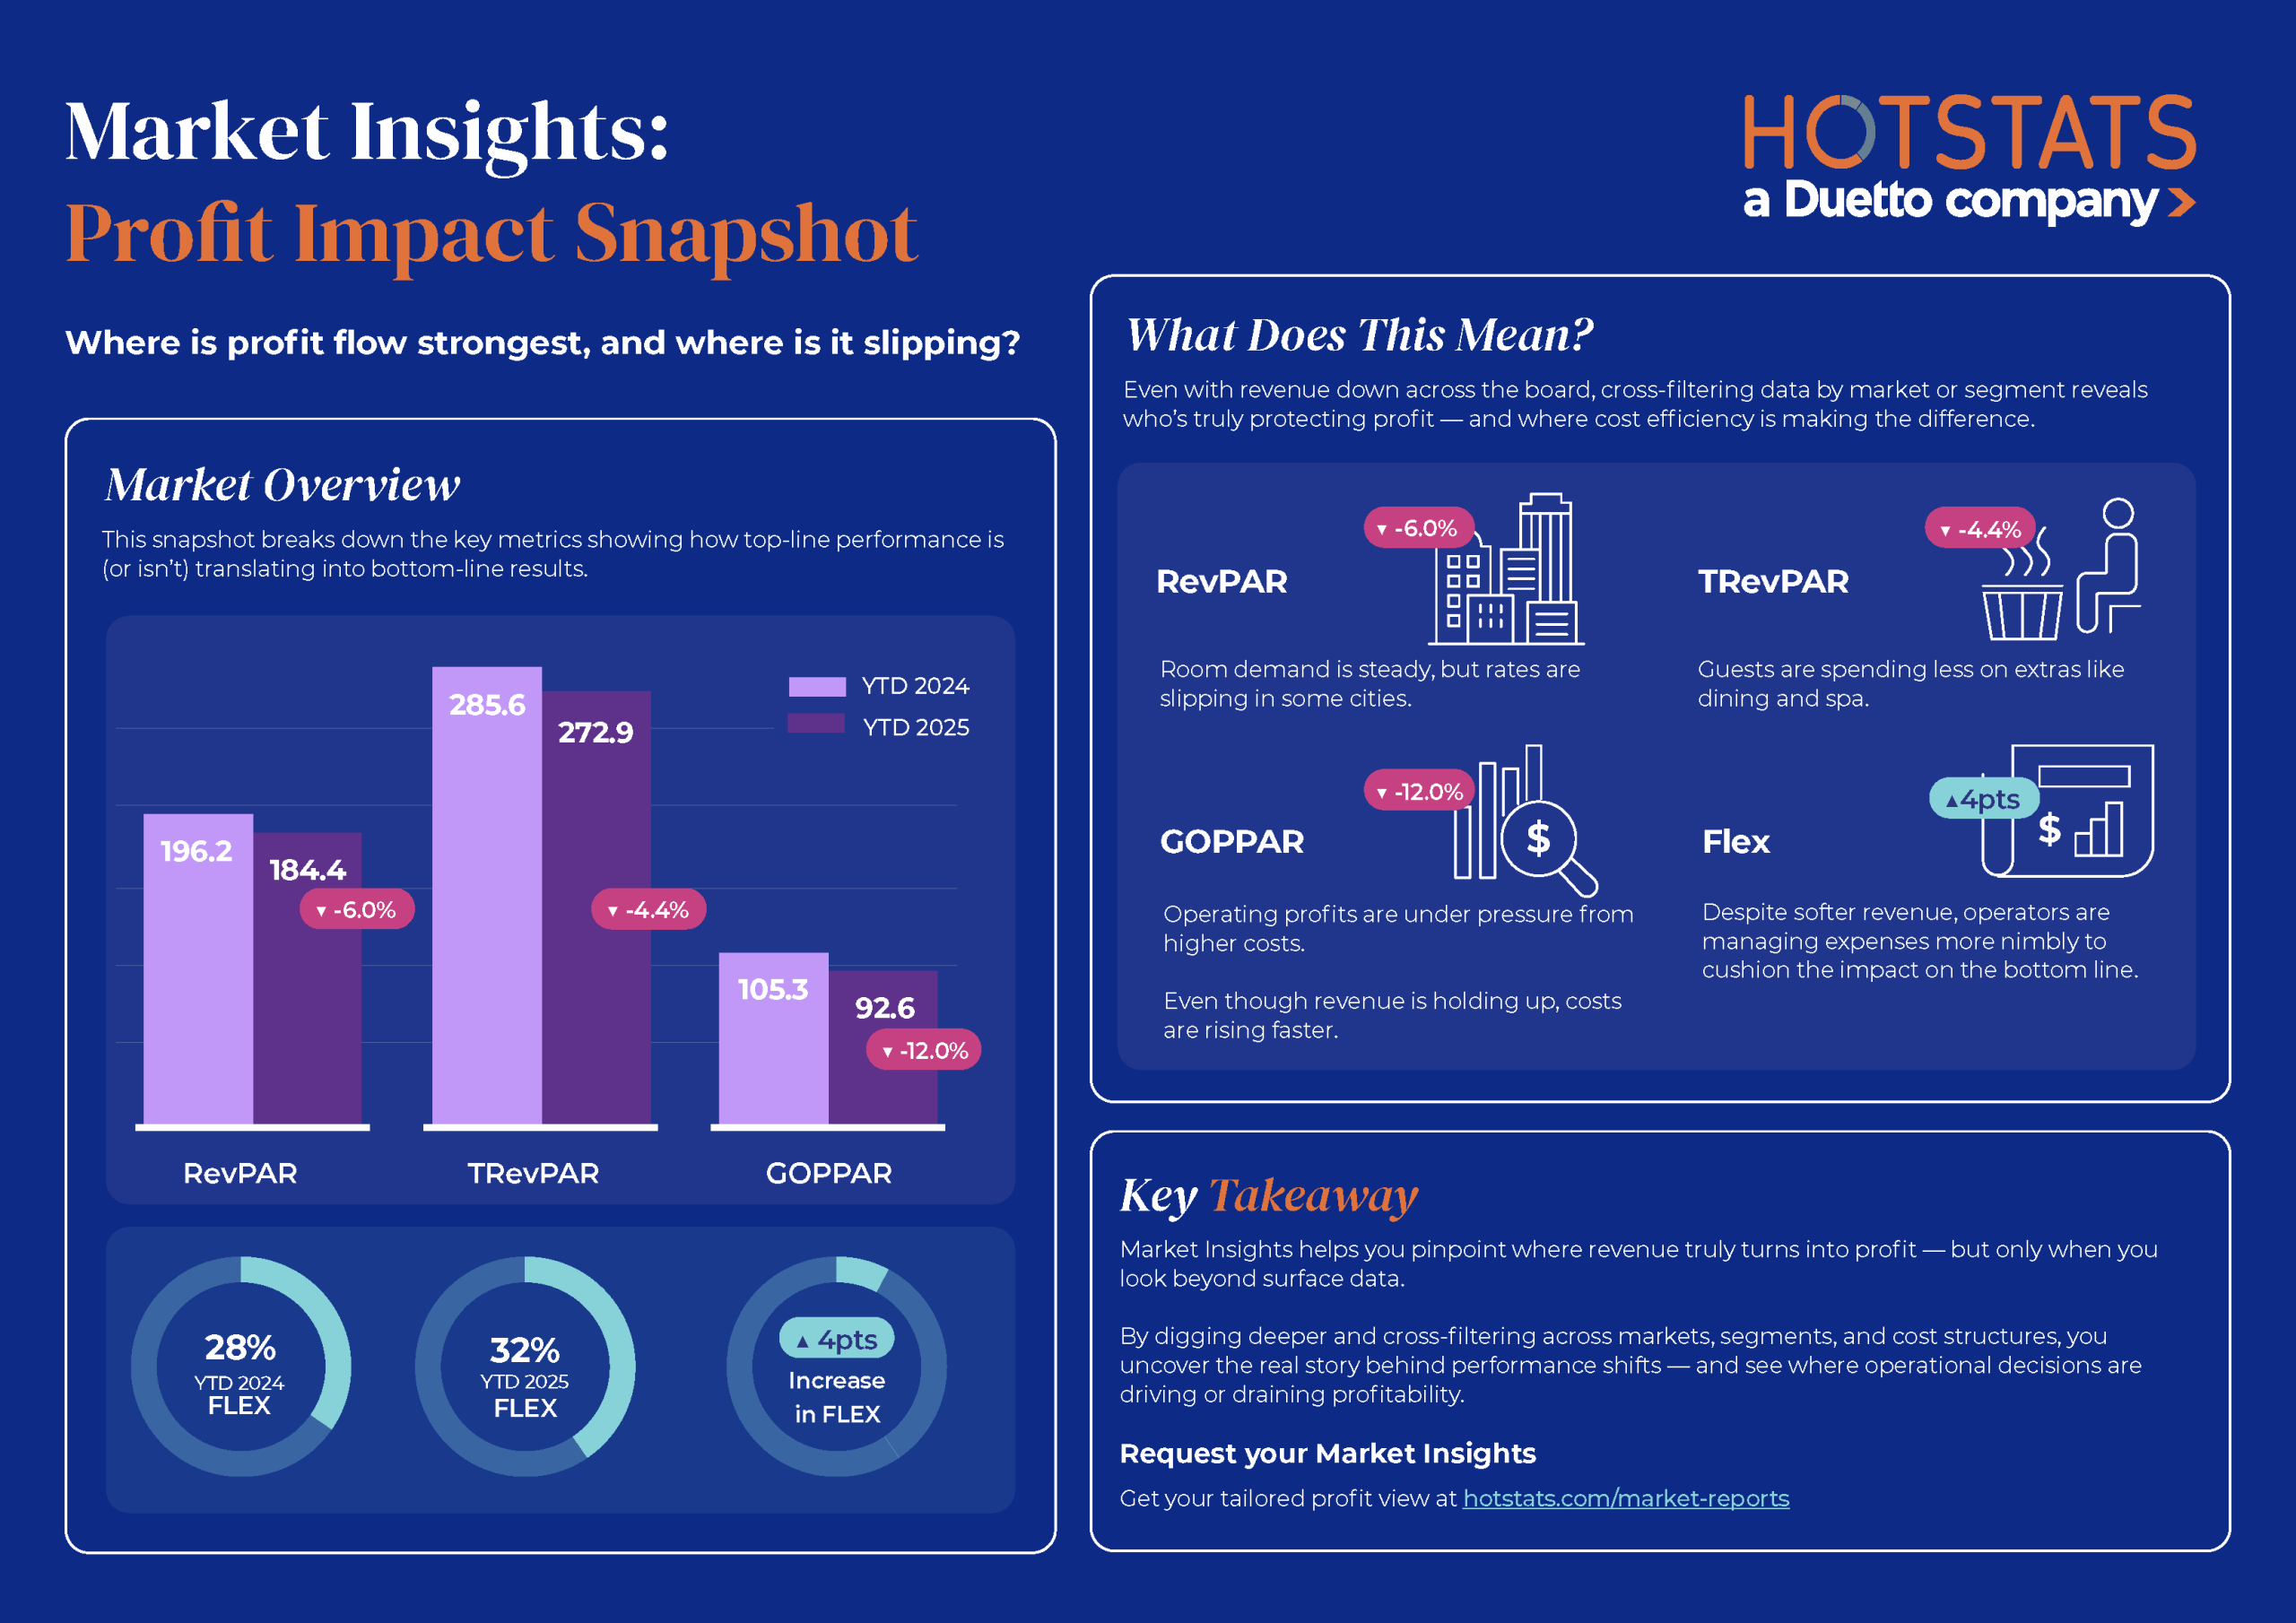
HotStats – Profit Impact Snapshot
RevPAR: The Room Revenue That Starts the Story
Revenue per Available Room (RevPAR) is one of the most watched indicators of hotel health.
At first glance, a 6% RevPAR dip with stable occupancy might seem manageable. But in reality, this points to rate resistance across competitive urban markets. Guests are returning, but price elasticity is back.
When RevPAR looks stable but costs are rising faster than rates, profit quickly erodes.
Takeaway for investors:
RevPAR trends alone can’t justify market optimism. Track how ADR growth compares to operating cost inflation to avoid overvaluing rate-driven markets with thin margins.
TRevPAR: The Total Revenue Picture
Total Revenue per Available Room (TRevPAR) captures all guest spend, from food and beverage to spa and parking.
Our example shows a 4% TRevPAR decline despite steady room demand – a red flag that ancillary revenue streams are softening. Travelers might still book, but they’re cutting back on F&B, spa, and on-property extras.
Takeaway for operators:
When TRevPAR slows, it’s time to re-evaluate how every square foot generates return. Consider F&B mix optimisation, service model adjustments, or repositioning high-cost amenities to protect profit contribution.