

Check the latest global hospitality statistics for 2023, including review volume evolution, impact scores, and defining trends shaping the travel industry. [updated quarterly]
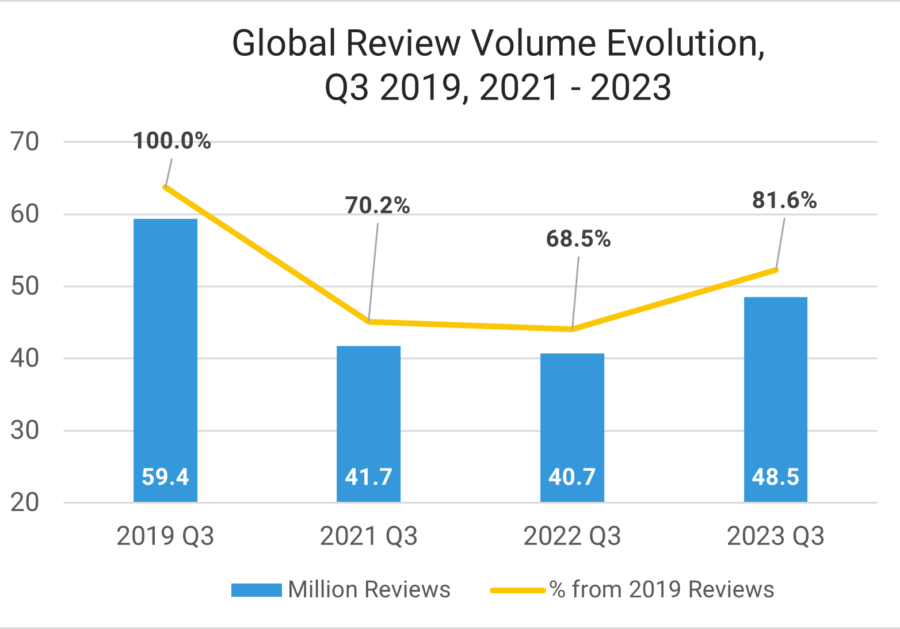
#1 Global Review Volume Continues to Increase
NB: This is an article from TrustYou
Subscribe to our weekly newsletter and stay up to date
The Q3 2023 review volume reached 81.6% of the 2019 levels and recorded a 19.2% increase compared to Q3 2022.
In Q3 2022, the review volume was 68.5% of 2019 reviews. Compared to January-March 2023, the review volume increased by 22.5%.
Other travel indicators show a similar growth pattern. In August 2023, the total amount of air travel, as measured by revenue passenger kilometers (RPKs), increased by 28.4% compared to August 2022. This represents 95.7% of the 2019 levels.
Specifically, domestic air travel in August 2023 experienced a 25.4% increase compared to the same month in 2022 and 9.2% higher than in August 2019. The strong demand for domestic flights in China mainly influences this significant growth.
For international air travel, there was a 30.4% rise compared to the same period last year and 88.5% of the August 2019 levels.
We noticed that review volume growth is slower than other indicators, such as the number of international arrivals or hotel bookings. Not all guests choose to leave reviews after their stays. Since many other tourist providers are looking for travelers’ feedback, consumers have become more selective in leaving reviews, choosing to share only the best or worst experiences they had. That’s why it’s crucial to send live or post-stay surveys to capture more of your guests’ opinions.
35.1% of travelers reading guest feedback are not leaving reviews because they are unaware of a survey or don’t know where to leave a review.
#2 Positive Feedback Remains High
In 2022, 92% of all feedback was positive. Hoteliers prove that providing a top-notch guest experience remains a top priority.
#3 Service and WiFi Continue to Shape Guest Satisfaction
Impact Scores use review data to determine how different factors affect the scores that guests leave. This is accomplished through semantic analysis, which extracts relevant information from reviews and estimates the impact of factors such as room maintenance on performance scores. Impact Scores are divided into positive and negative scores, and different categories such as service, WiFi, parking and location are used to determine how many points can be lost or gained in each category.


