Building on October’s GOPPAR gains, UK hotels successfully produced a second consecutive month of profit growth in November, positioning hotels in the region to achieve another successful year of trading, according to the latest data tracking full-service hotels from HotStats.
UK’s hotels have fought back to profitability following the 4.9-percent year-on-year decline recorded in Q1 2018. Now having chalked up five months of YOY profit growth, including two consecutive monthly increases in October (up 9.0 percent) and November (up 2.3 percent), hotels in the region have now recorded a 1.1-percent increase in GOPPAR year-to-date 2018.
The growth in profit in November was led by increases across all revenue centres, including Rooms (up 3.1 percent), Food & Beverage (up 3.0 percent) and Conference & Banqueting (up 3.2 percent), on a per-available-room basis.
As a result, TRevPAR increased by 3.0 percent this month to £151.27. The solid November performance put YTD TRevPAR at 2.1 percent above the same period in 2017, at £142.44.
Growth in revenue in the month was supported by cost savings, which included a 0.3-percentage-point drop in payroll to 27.5 percent of total revenue.
The positive movements in revenue and cost enabled hotels to record a profit conversion of 38.1 percent of total revenue for the month. Whilst this is slightly below the conversion recorded in November 2017, at 38.3 percent of total revenue, it is in line with the YTD figure.
Profit & Loss Key Performance Indicators – Total UK (in GBP)
November 2018 v. November 2017
RevPAR: +3.1% to £94.97
TRevPAR: +3.0% to £151.27
Payroll: -0.3 pts. to 27.5%
GOPPAR: +2.3% to £57.58
Growth in rooms revenue in November was led by an increasingly rare increase in both room occupancy, which grew by 0.6 percentage points to 79.1 percent, as well as a 2.4-percent increase in achieved average room rate, which increased to £120.03 for the month.
“Whilst other other investment sectors, particularly retail, appeared to wobble ahead of the Christmas break and the unknowns of 2019, the UK hotel market is remaining resilient. The stronger performance in the second half of 2018 means hotel owners and operators in the UK are all set for another year of profit growth following the 5.1-percent increase in 2017,” said Michael Grove, Director of Intelligence and Customer Solutions, EMEA, HotStats.
In line with growth across the UK, properties in the challenging Aberdeen market recorded a slight 0.8-percent increase in profit per room in November.
The GOPPAR increase came as RevPAR decreased 3.6 percent YOY. It fell to £42.83—disappointing following a relatively positive period of performance throughout the summer.
The drop in RevPAR was in spite of a 2.8-percentage-point increase in room occupancy, which grew to 72.5 percent, as volume in the city maintains its recovery. However, achieved average room rate declined 7.3 percent, dropping to £59.04. TRevPAR declined 0.3 percent YOY.
Meanwhile, the increase in volume in November helped to drive ancillary revenues, which included a 6.6-percent YOY increase in Food & Beverage, as well as a 48.7-percent increase in Conference & Banqueting, on a per-available-room basis.
In addition to a 0.3-percentage-point decrease in payroll, hotels in Aberdeen successfully recorded a 1.8-percentage-point reduction in overheads, to 28.6 percent of total revenue.
Still, YTD profit levels remain 1.5-percent below the same period in 2017, with profit conversion of just 24.9 percent of total revenue.
“It has been a very tough few years of trading for hotels in Aberdeen due to the fall out of demand, as well as increases in supply, illustrated by the poor rate performance this month, which was ahead of only August,” said Grove. “However, the fact that hoteliers have managed to generate a profit increase from a fairly substantial RevPAR decline is highly commendable.”
Profit & Loss Key Performance Indicators – Aberdeen (in GBP)
November 2018 v. November 2017
RevPAR: -3.6% to £42.83
TRevPAR: -0.3% to £60.69
Payroll: -0.3 pts. to 32.5%
GOPPAR: +0.8% to £15.23
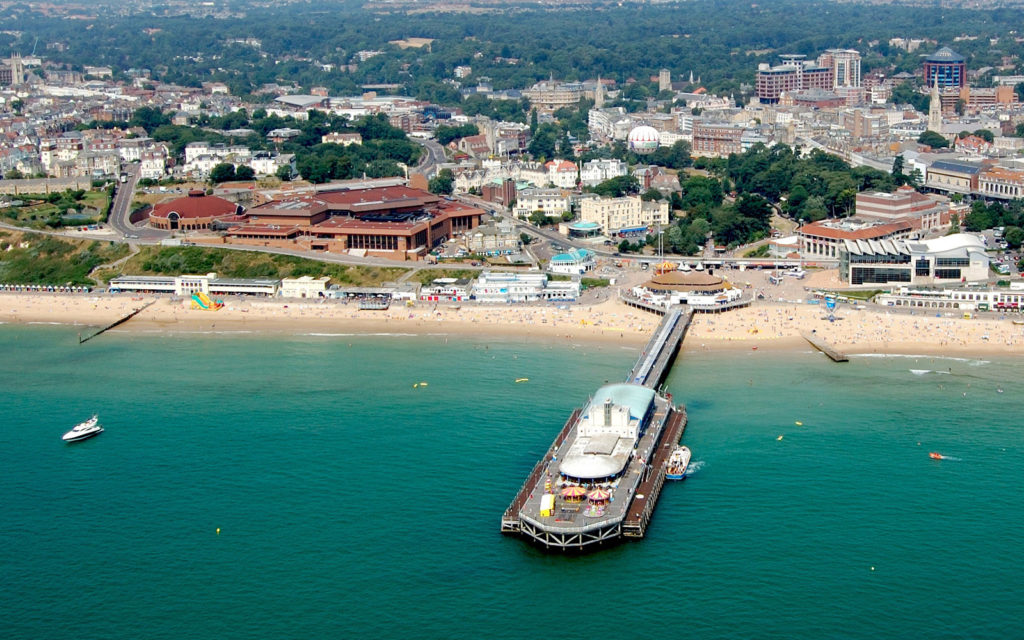
In contrast to the static performance of hotels in Aberdeen, properties in Bournemouth recorded a 12.9-percent YOY increase in profit per room in November to £13.23.
This was the first month that hotels in the coastal town have recorded a YOY increase in profit per room following a punchy summer performance when GOPPAR hit a record £63.66 in August.
The growth in profit was led by an 11.7-percent increase in RevPAR, which was fuelled by an 8.1-percent increase in achieved average room rate to £79.72. This in spite of recent challenges to rate performance in the city.
In addition to the growth in rooms, an increase in revenue was recorded across all non-rooms departments. As a result, TRevPAR for hotels in Bournemouth grew by 10.4 percent YOY to £77.05.
The growth in revenue was further supported by costs savings, which included a 1.1-percentage-point drop in payroll, which remained high at 34.2 percent of total revenue.
As a result of the movement in revenue and costs, profit conversion at hotels in Bournemouth was recorded at just 17.2 percent of total revenue—a reasonable number for the off-season in the resort town.
Profit & Loss Key Performance Indicators – Bournemouth (in GBP)
November 2018 v. November 2017
RevPAR: +11.7% to £55.61
TRevPAR: +10.4% to £77.05
Payroll: -1.1 pts. to 34.2%
GOPPAR: +12.9% to £13.23
Glossary:
Occupancy (%) – Is that proportion of the bedrooms available during the period which are occupied during the period.
Average Room Rate (ARR) – Is the total bedroom revenue for the period divided by the total bedrooms occupied during the period.
Room Revpar (RevPAR) – Is the total bedroom revenue for the period divided by the total available rooms during the period.
Total Revpar (TRevPAR) – Is the combined total of all revenues divided by the total available rooms during the period.
Payroll % – Is the payroll for all hotels in the sample as a percentage of total revenue.
GOP PAR – Is the Total Gross Operating Profit for the period divided by the total available rooms during the period.


