

Revenue management is not easy. Maintaining complex, sophisticated systems requires RM analysts with an often tough-to-find mix of market knowledge, business acumen, analytical and communication skills.
NB: This is an article by Tom Bacon at Eye for Travel
Many travel companies invest heavily in training and recruitment for this high impact and strategic department. New visualisation techniques, however, can further improve RM performance, broaden understanding, and invite new perspectives. “Visualisation” is now a common topic of discussion at revenue management conferences.
To achieve the potential benefits, experts cite certain best practices for visualisation. The first is that the visualisation must correspond to an intuitive understanding of the underlying problem.
A key underlying problem for airline revenue management, of course, is inventory allocation – how many seats should be set aside for each fare range. When does it make sense to turn away demand in the hope that a higher fare passenger will book later?
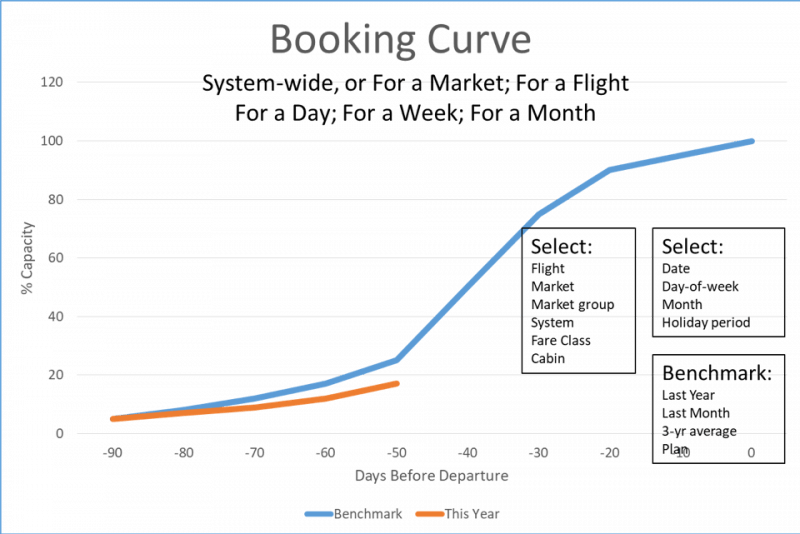
It is intuitive that certain lower fare demand should be turned away if booking velocity remains strong and the plane is projected to be full. Similarly, more low fare inventory needs to be made available when bookings slow down leaving empty seats. To visualise such booking velocity, probably one of the oldest, and always valuable, visualisations in RM is the booking curve.
The booking curve shows how an airplane fills up over time, generally with relatively few bookings more than 90 days before the flight, with bookings accelerating in the 14 day to 90 day range, and then levelling off as the plane is full and as the fare approaches full price. Monitoring bookings against a historic booking curve for a flight allows the analyst to assess whether bookings are ‘on track’ or whether inventory management should become more or less aggressive (action-oriented!).
Booking curves may be displayed for all flights in a period (for a day or over a month) or, drilling down, for a market or for a flight. Visualisation of big data is most useful when it can both summarise lots of data points and also facilitate extremely micro-perspectives.
Elements of successful visualisation:
- Summarises information that otherwise would require multiple tables; highlights size and scale
- Action-oriented! Leads analysts to potential intervention
- Useful at multiple levels of aggregation; lends itself to drilling down to extremely micro levels
- Tool for communication of business practices across functions and levels in an organisation
The last element above, communication across functions and levels, is especially relevant in revenue management. RM is often a black box, managed by skilled analysts separated organisationally from employees with direct interaction with customers. There are often conflicts with sales, marketing, and e-commerce regarding pricing. Finance, too, may view RM as mysterious even as it relies on RM for short-term and long-term revenue forecasts. Operations must deal with passengers impacted by overbooking.
Visualisations have the potential to ‘democratise’ the analytics, giving new understanding to less quantitative functions that interact with RM. Such visualisations can show sales and marketing, for example, why RM is taking action: either reducing or freeing up lower fare inventory.
Visualisation needs to be applied across RM, including the purchase funnel, overbooking rates, and new social media tracking. In fact, there are many opportunities for increased use of visualisation in revenue management – to aid RM analysts in managing bigger and bigger data and increased complexity and to help communicate RM actions across the organisation.
Many airlines extract data from multiple sources and develop their own such visualisations; increasingly, RM systems offer visualisations to supplement standard data tables. However, expert use of visualisations is in its infancy. Airlines and RM system suppliers can create a competitive advantage by leading the industry in visualisation.


