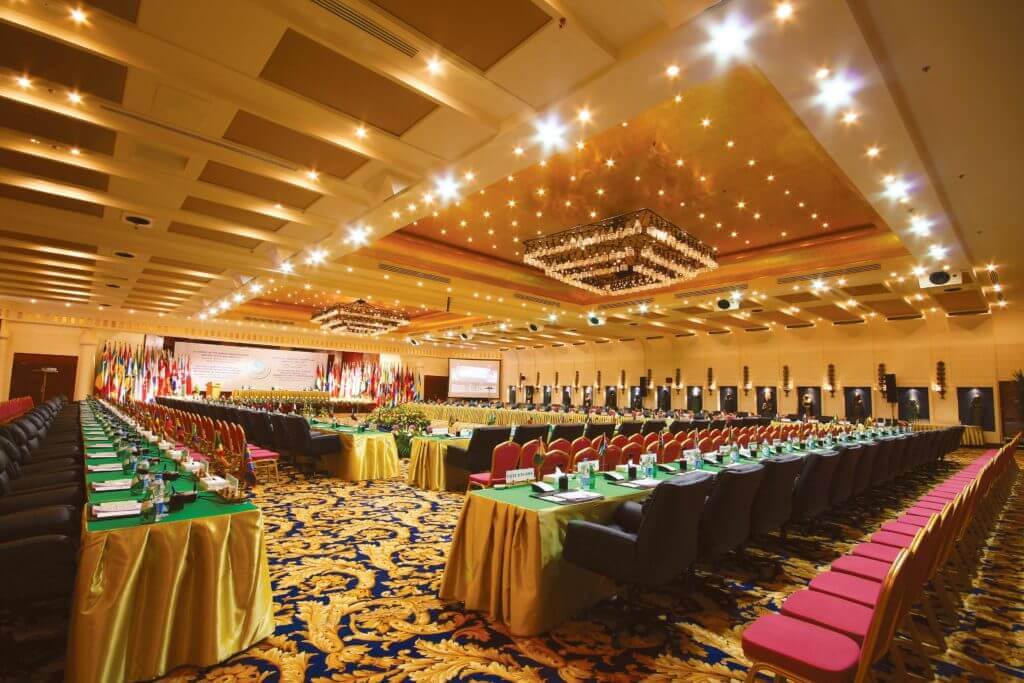
The discipline of revenue management continues to evolve and expand into more revenue-generating areas of a hotel. As hotels start to think about some of these key areas where revenue management can have a major impact — meetings & events (M&E) is often at the top of that list. Hotels have ADR, occupancy, RevPAR and even more profit-focused metrics like GOPPAR to evaluate the success of their guest room strategy. When building a strategy for M&E, here are the key performance indicators (KPIs) that can help your next great RM strategy take flight.
Revenue Per Square Foot/Meter
Revenue per square foot/meter is the great equalizer, much like RevPAR is for guest rooms. Hotels can fill their meeting space with all kinds of catering business, or use their meeting space to fill sleeping rooms, but to properly measure the success of an M&E strategy this metric is pivotal. Understanding your revenue performance, in relation to the available space, allows hotels to set benchmarks for M&E performance which leads to the effective utilization of space.
Once hotels have insights into their revenue per square foot/meter they can compare performance by day of week, month or even by function room. This insight helps hotels understand their highest revenue-generating space and deploy pricing based on a clear picture of demand. Revenue per square foot/meter provides commercial opportunities for a hotel by knowing which space is most valuable and could possibly be underutilized.
Attendee Density
Attendee density is the percentage of actual attendees in relation to the optimal capacity for the given venue. As an example, if a hotel had a small ballroom that held 100 persons and on a given day sold it to a group that had 75 attendees, then the attendee density for that ballroom would be 75%.


